Introduction
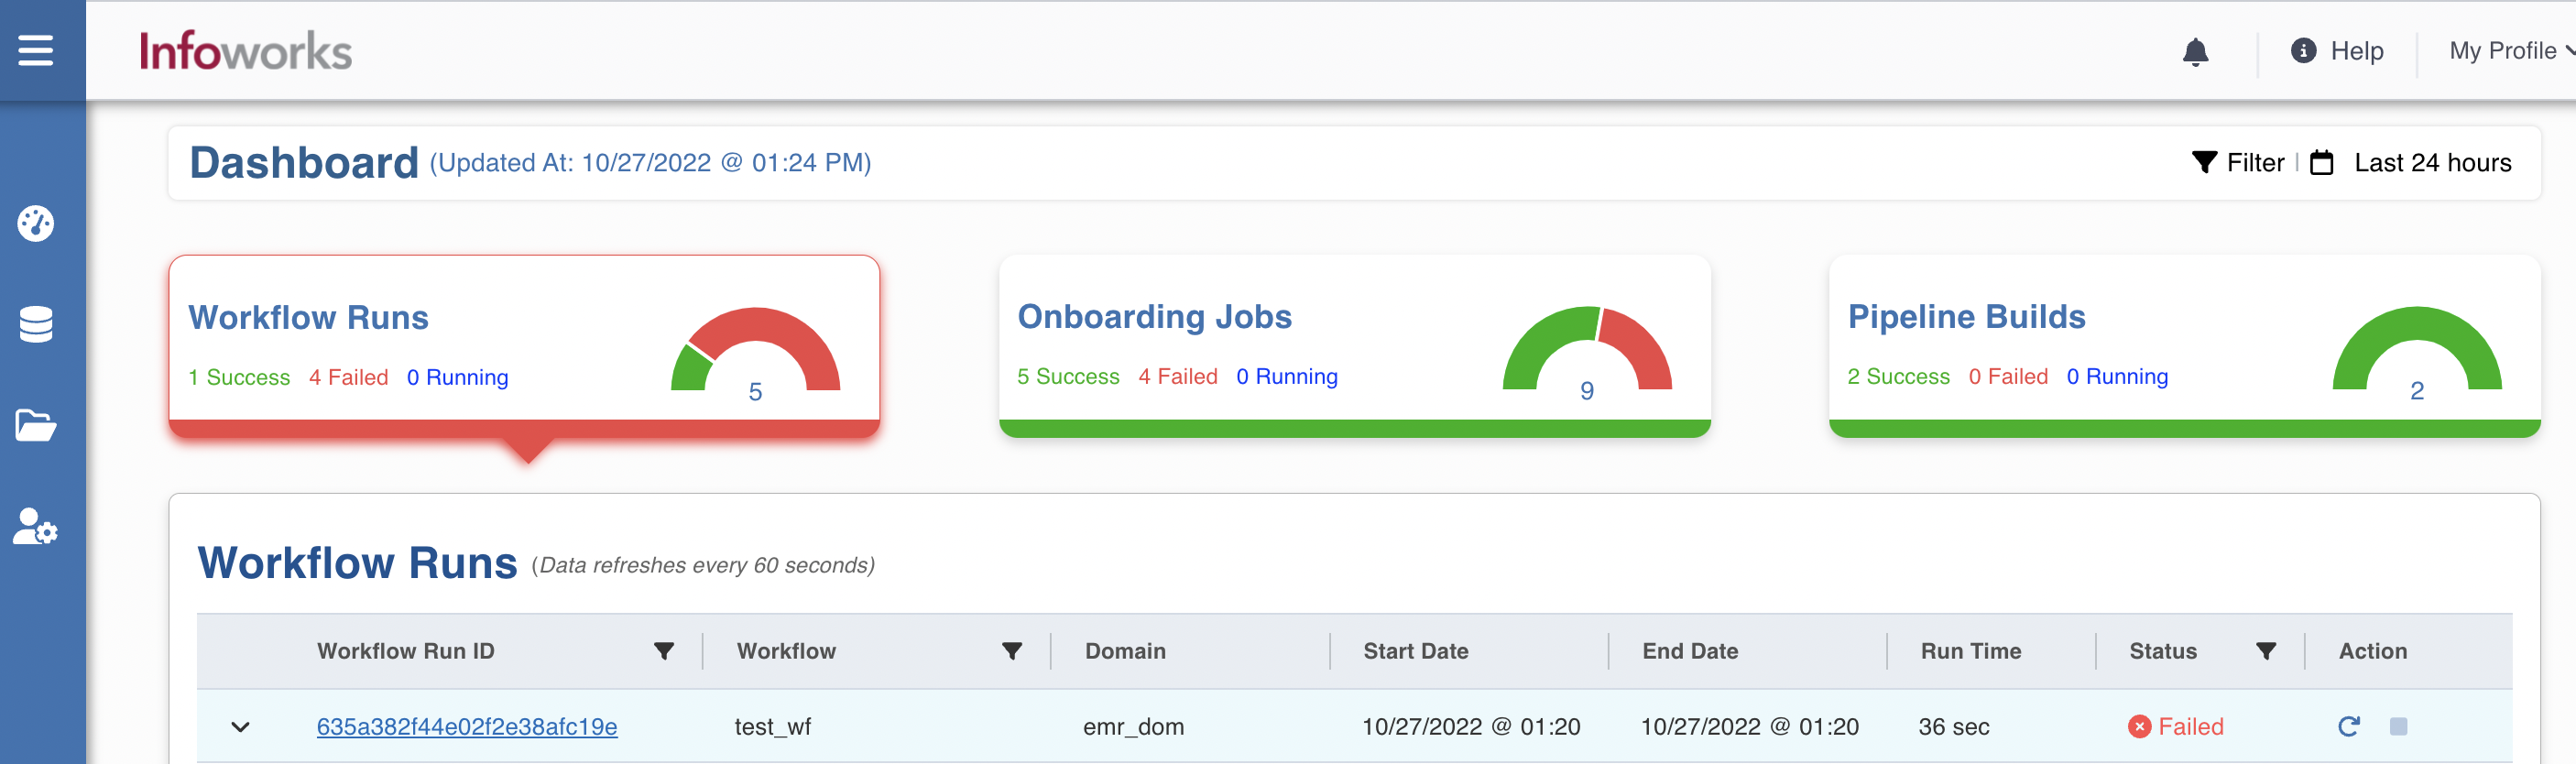
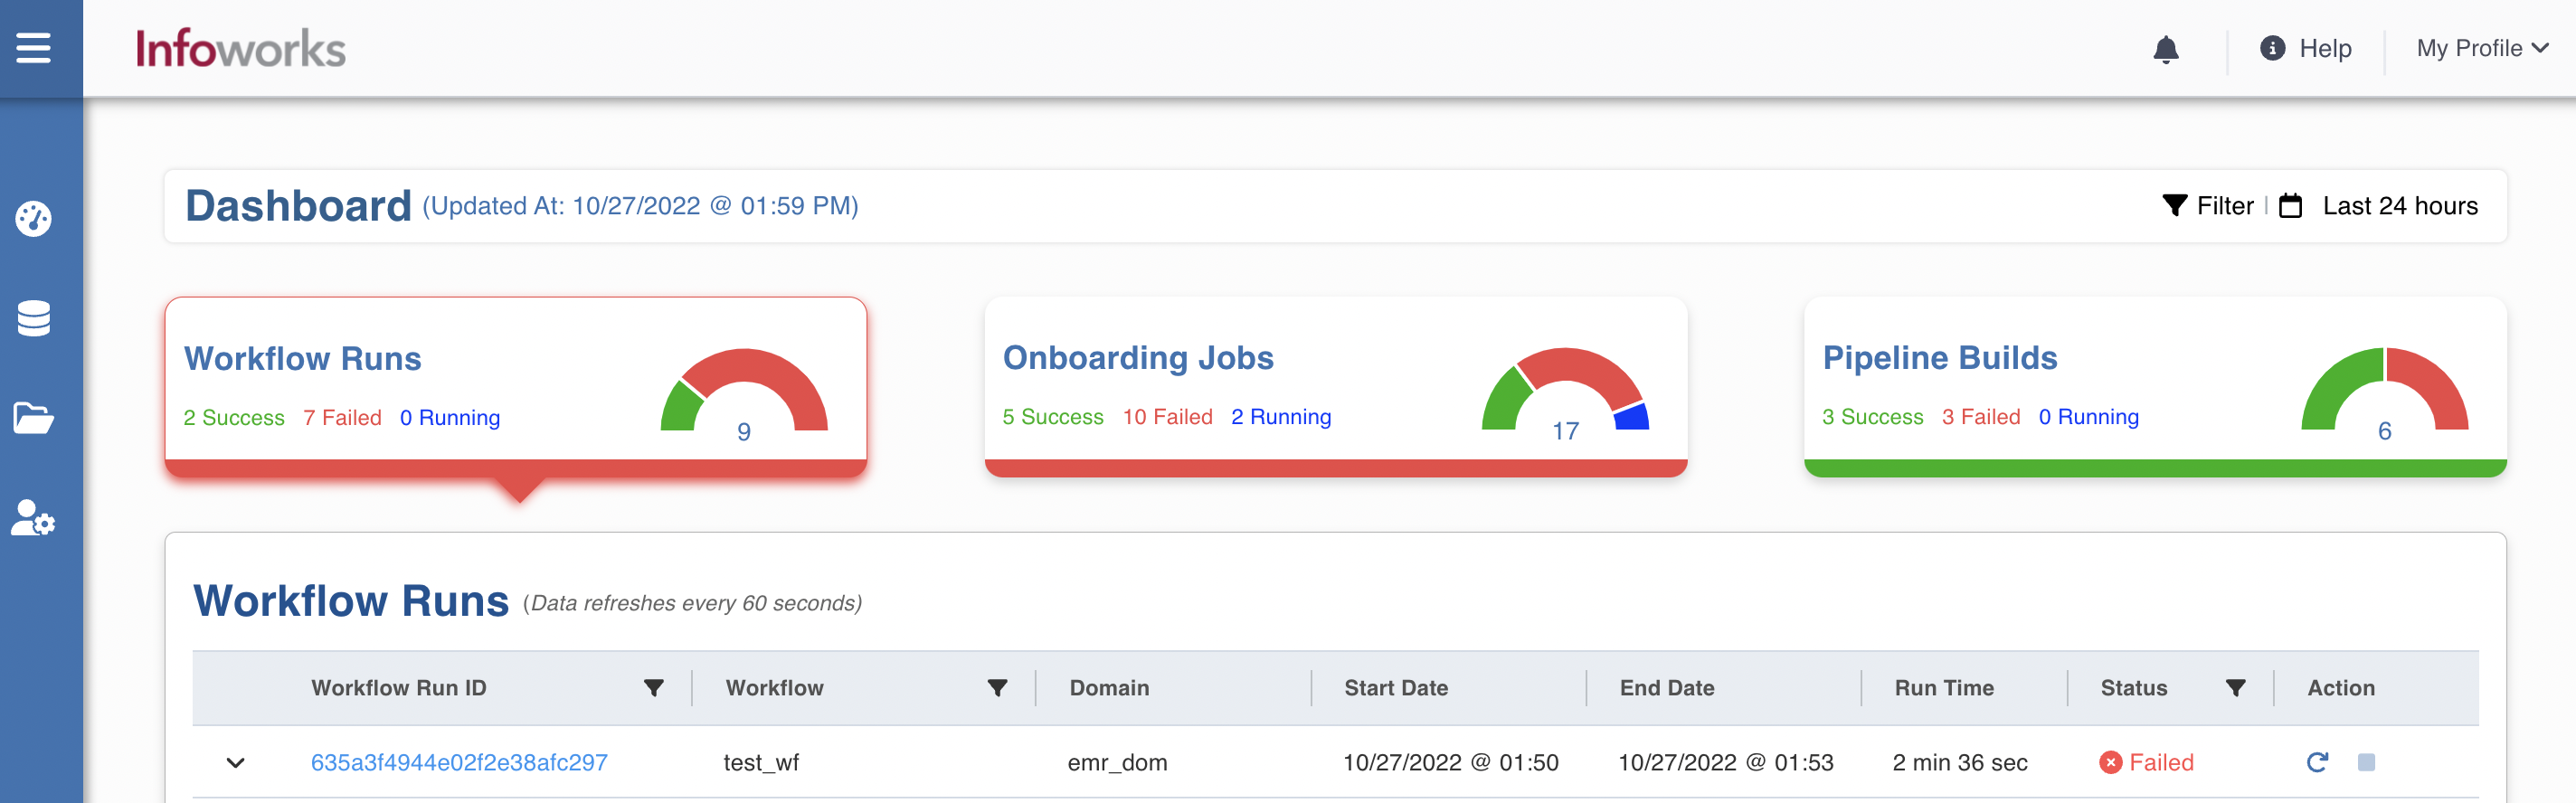
This dashboard is designed for use by an Operations Analyst who monitors data management processes in a production setting. It provides a bird’s eye view of the status of Workflow Runs, Onboarding Jobs, and Pipeline Builds and provides filtering and drill-down capabilities to locate and fix problems quickly. The Workflow runs widget shows the list of workflows that have failed, currently running, or completed. By default, it shows the last 24 hours of operation.
Workflow Runs
Workflow runs widget depicts the list of workflows that have failed, currently running, or completed.
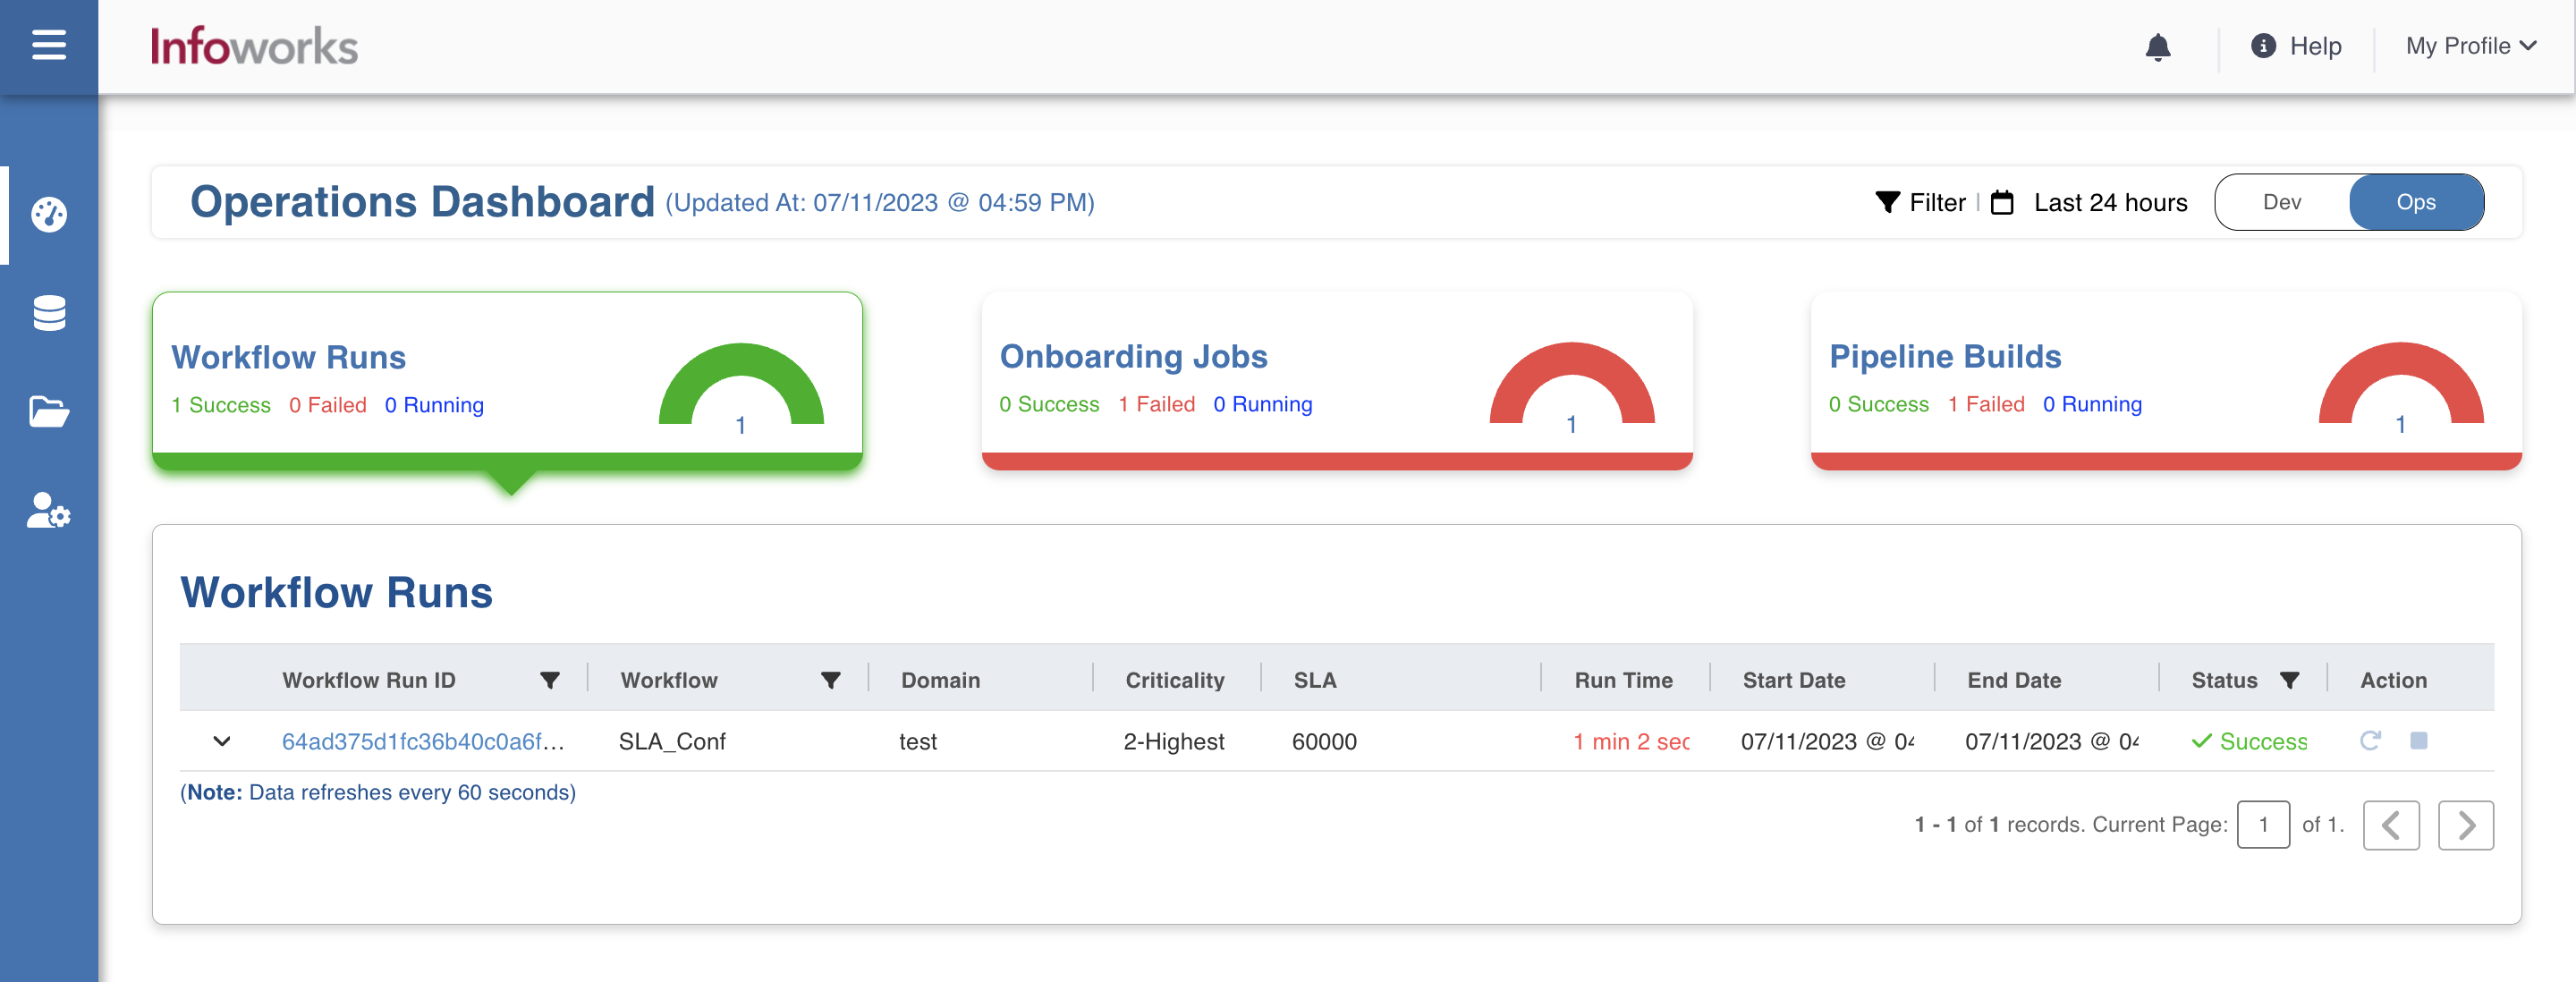
The workflow related information appears in the Workflow Runs table. For more information, refer to following table.
| Field | Description |
|---|---|
| Workflow Run ID | Unique ID assigned to the workflow run. |
| Workflow | Name of the workflow |
| Domain | The domain a specific workflow belongs to. |
| Criticality | Configured criticality on respective workflow in SLA configuration. |
| SLA | Expected time of completion. |
| Start Date | The timestamp on which the workflow was initiated. |
| End Date | The timestamp when workflow ended. |
| Run time | Total running duration of the workflow (it will be highlighted in red when SLA is missed). |
| Status | Status of the run. For example, Success, Running, and Failed |
| Actions | You can perform the following actions, namely: Restart: For failed workflows, you can restart the workflow run. Cancel: For the currently running workflows, you can stop the workflow run. |
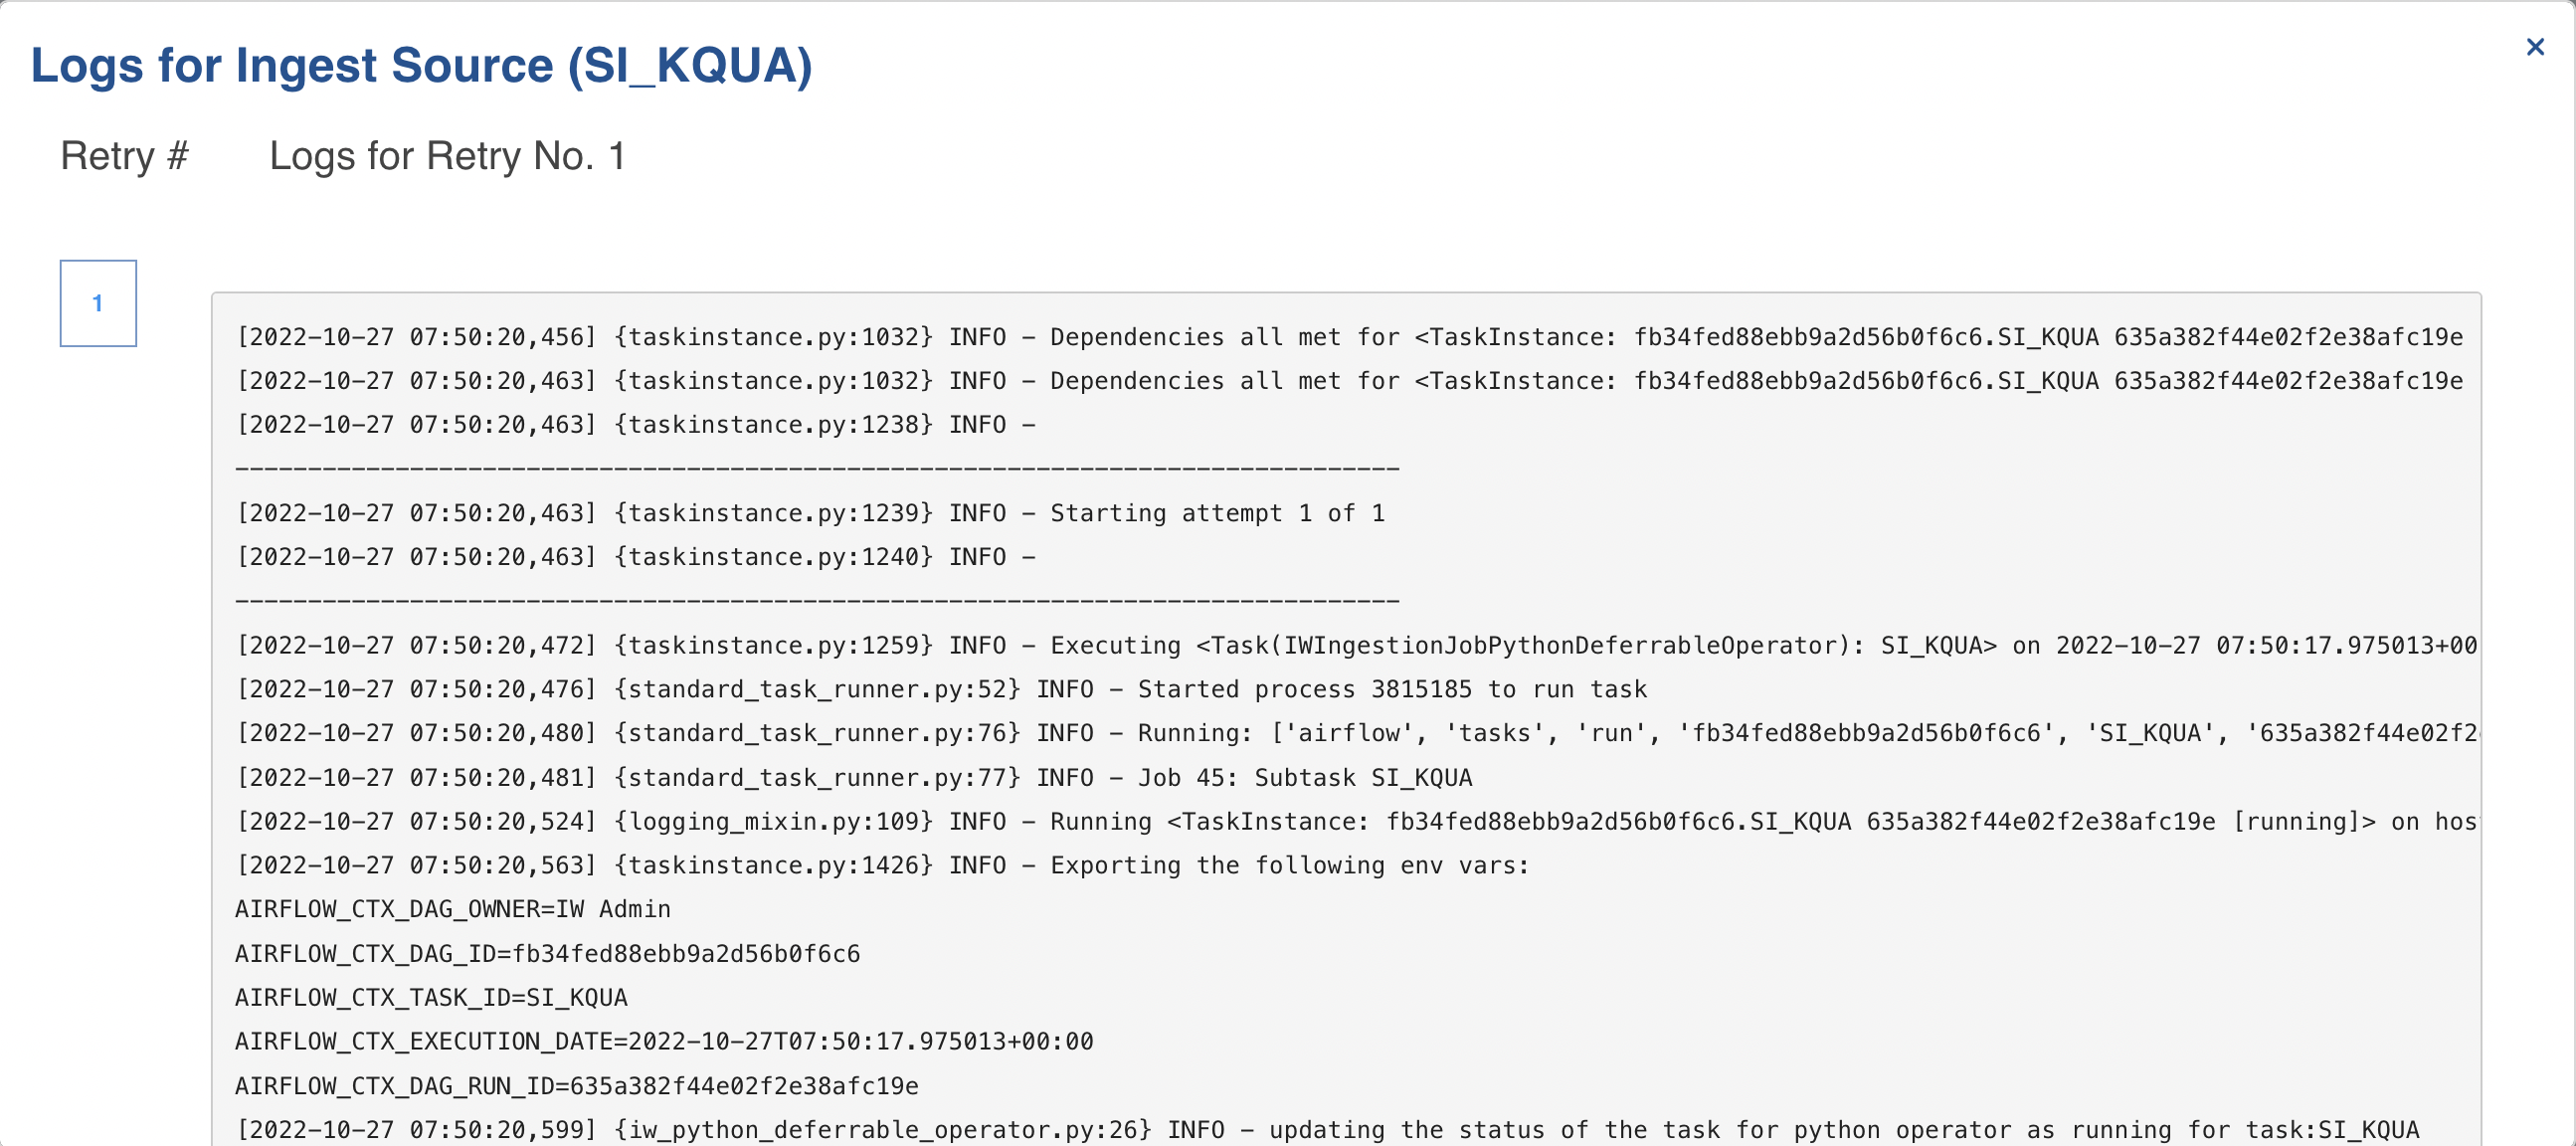
Viewing Failed Workflows
Operations Analyst dashboard enables you to view the log files for the failed workflows, which helps you in performing Root Cause Analysis (RCA) and in rectifying the underlying issues.
The workflow can fail due to two reasons:
- Tasks
- Jobs
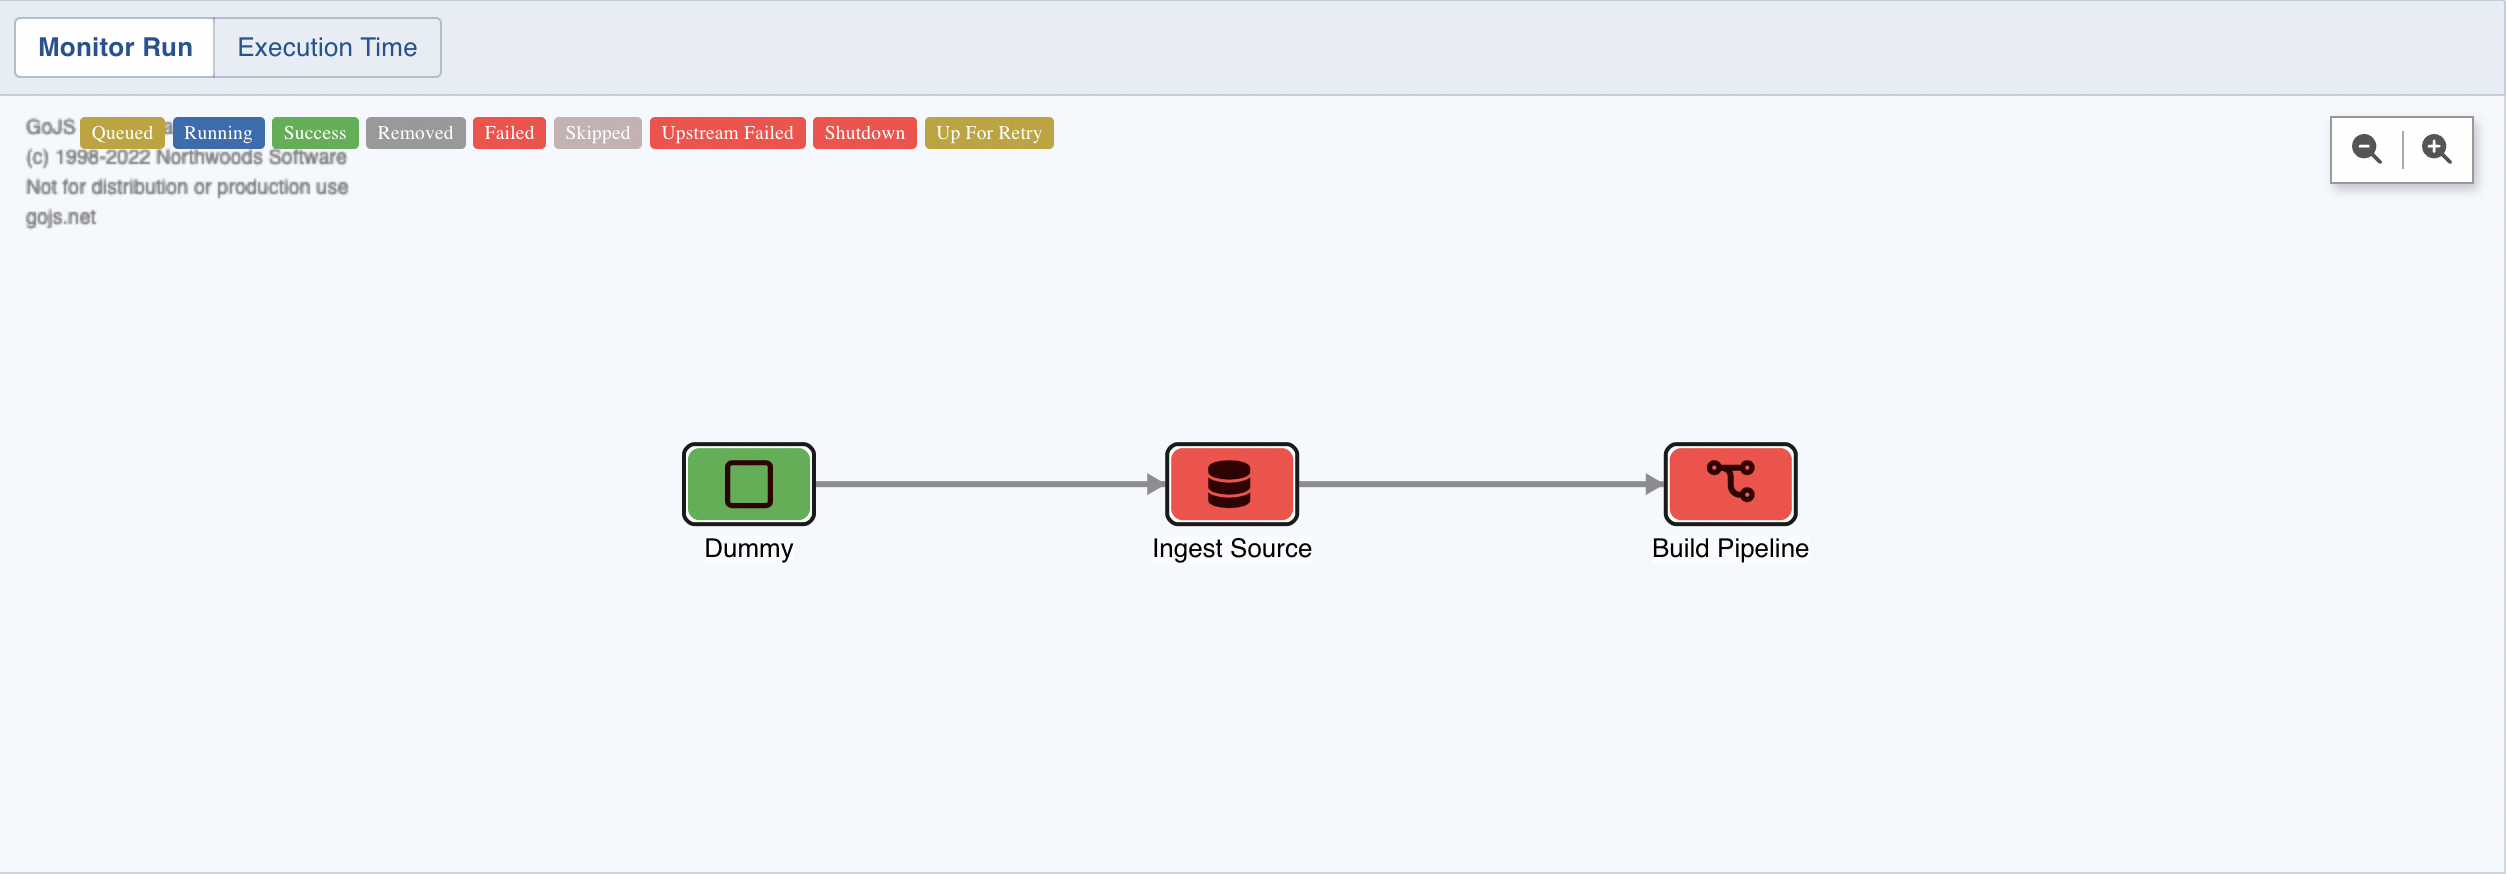
To view logs for a failed task:
Step 1: Click any failed Workflow Run ID. The Workflow build page appears.
Step 2: Click the failed task, i.e. Ingest Source icon. The task popup appears.

Step 3: Under the Logs section, click View.
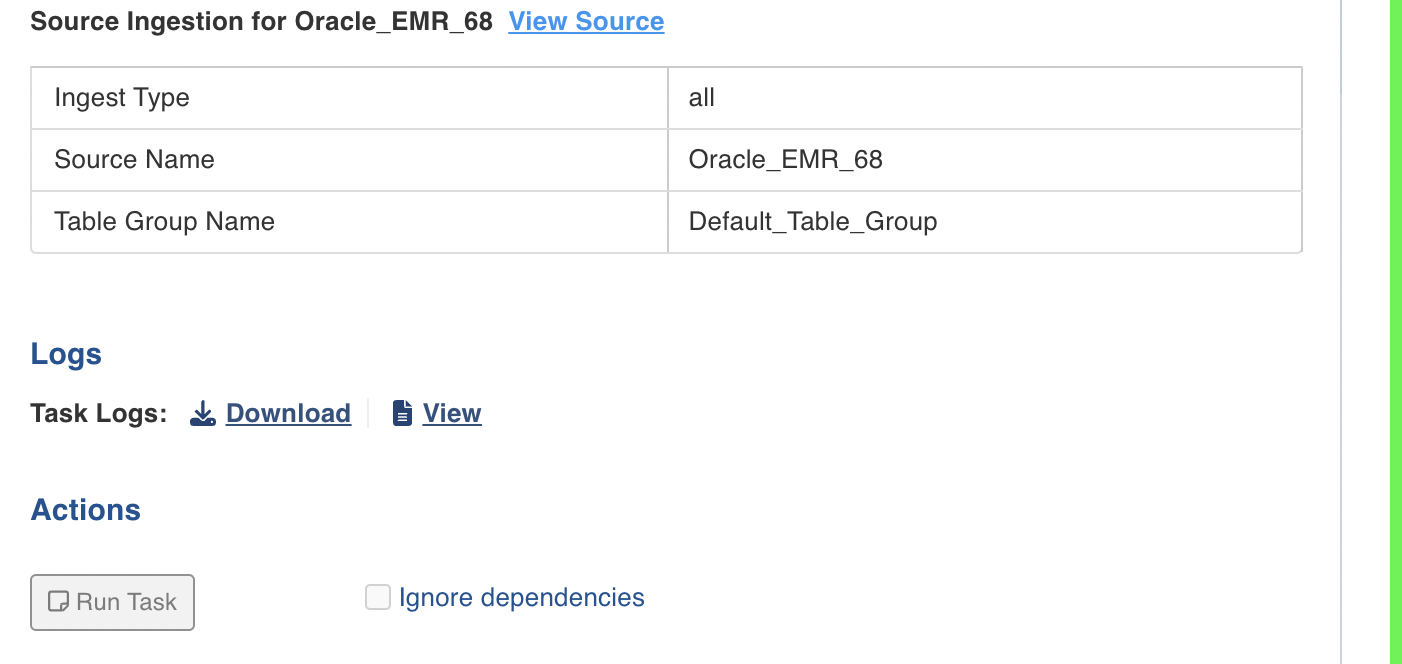
The logs of the failed task appear. This log information helps you in identifying the issue.
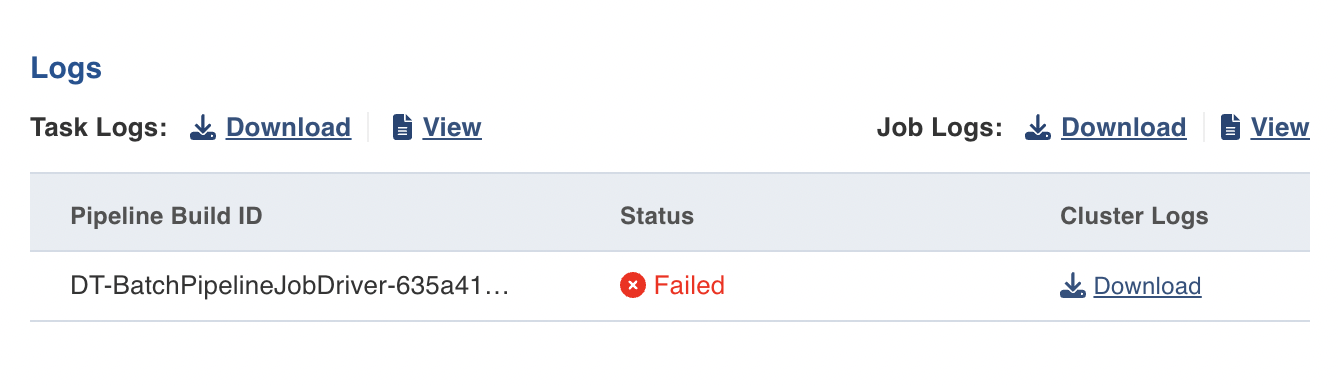
To view logs for a failed job:
Step 1: Click any failed Workflow Run ID. The Workflow build page appears.
Step 2: Click the failed job, i.e. Build Pipeline icon. The Build Pipeline popup appears.
Step 3: To view job logs that failed from control plane, click the Download icon which appears in front of the Job Logs label, Similarly, to view job logs that failed from data plane, click the Download icon which appears under the Cluster Logs column.
Drill-down Support
Operations Analyst dashboard provides the drill-down capability, which enables you to
- monitor the currently running workflows.
- identify the issues behind jobs that have failed and troubleshoot them accordingly.
- view successful workflows.
To view jobs of a particular workflow run, perform the following procedure:
Step 1: Click the chevron icon which is just next to the failed Workflow Run ID. The list of jobs appear.

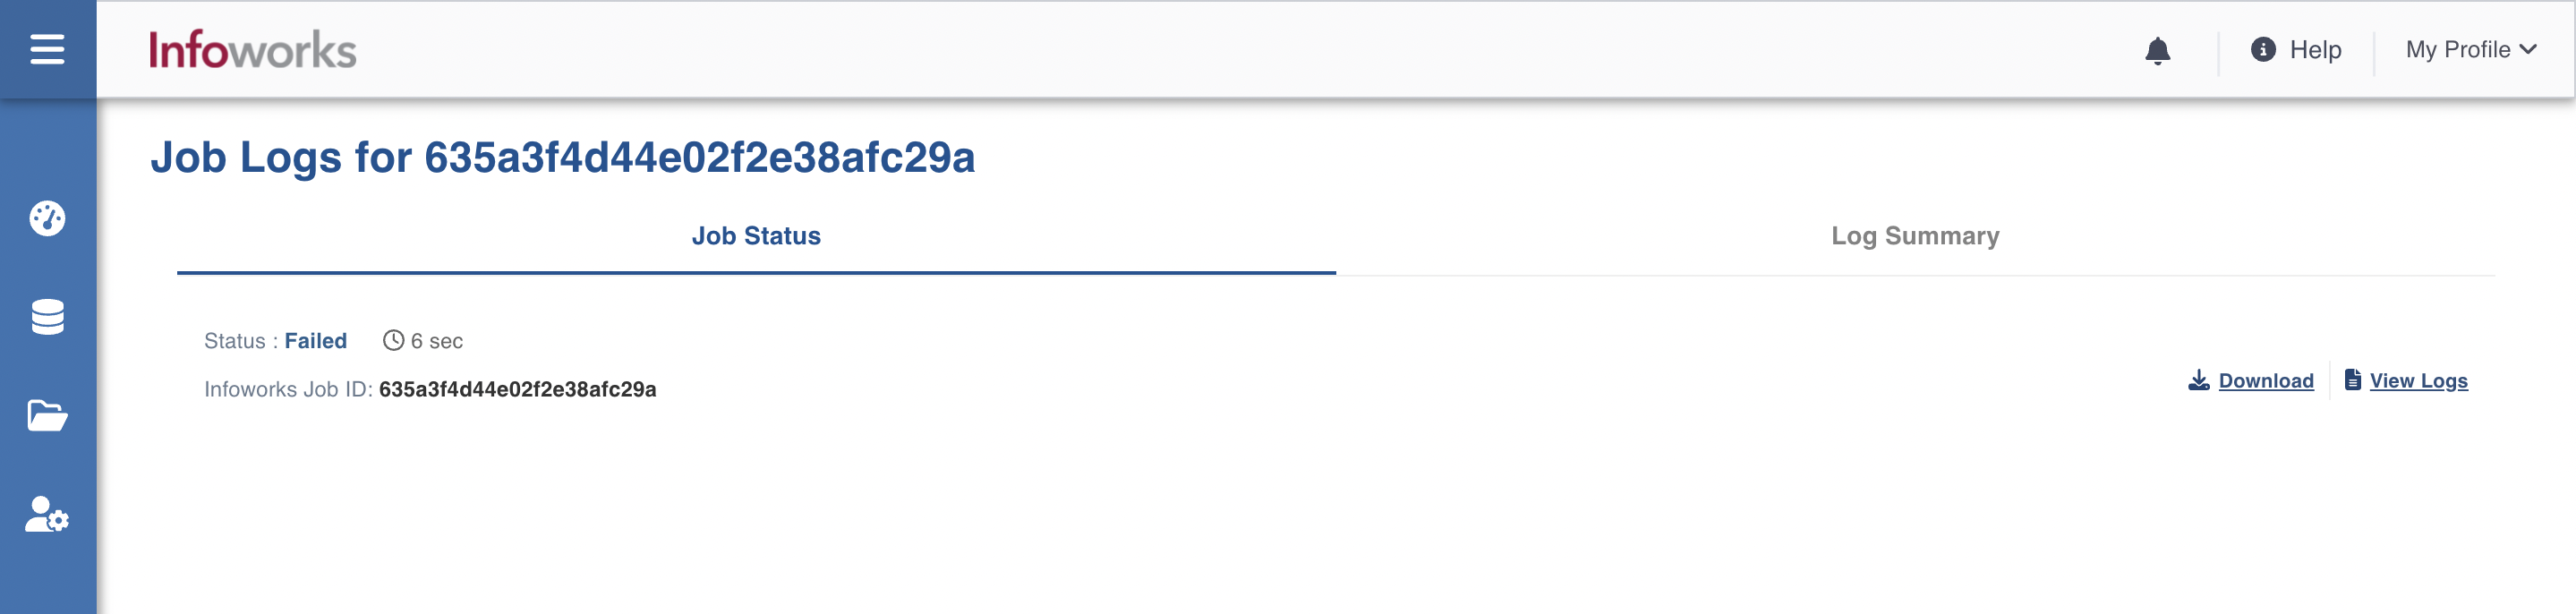
Step 2: Click the Job Id for which you want to download logs.
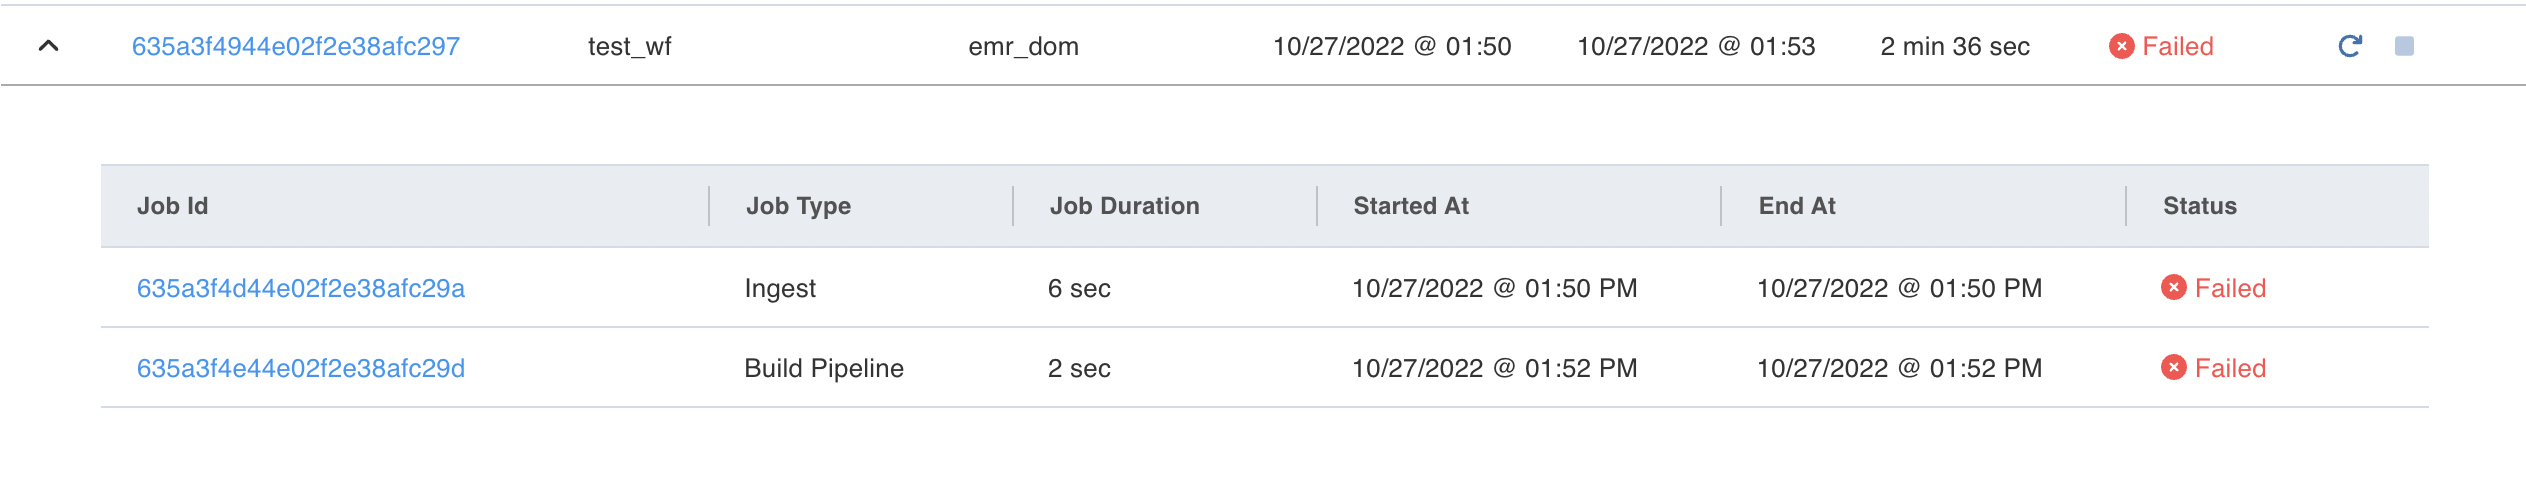
Step 3: Under the Job Status tab, click the Download icon to download the log files.
Onboarding Jobs
This widget shows ingest and export data job types.
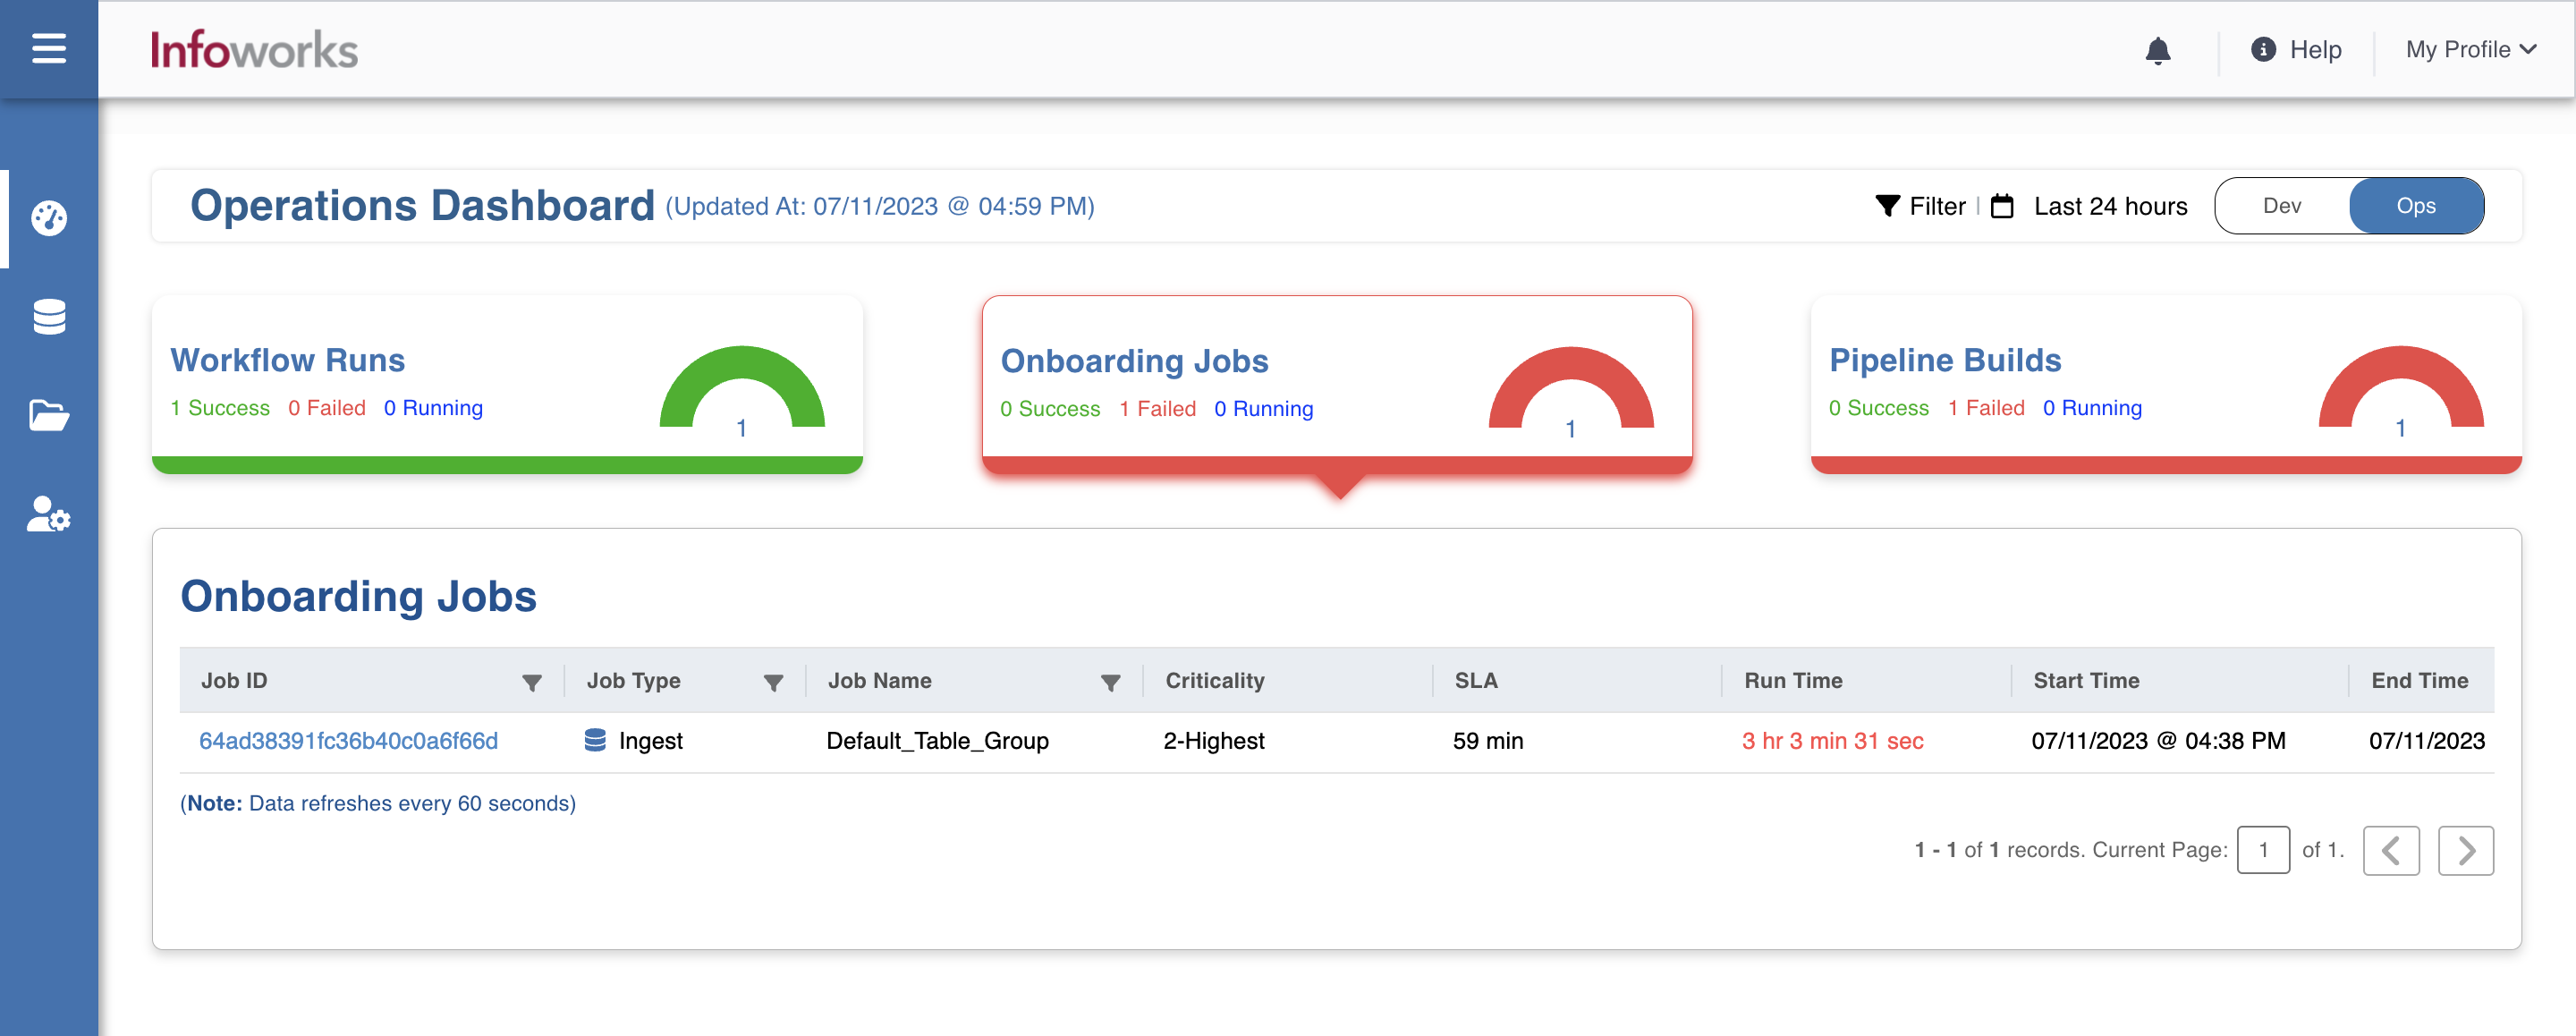
When you click the Onboarding Jobs widget, the jobs related information appears in the Onboarding Jobs table. For more information, refer to the following table.
| Field | Description |
|---|---|
| Job ID | Unique ID assigned to the onboarding job. |
| Job Type | The type of onboarding job. |
| Job Name | The name this onboarding job belongs to. |
| Criticality | Configured criticality on respective workflow in SLA configuration. |
| SLA | Expected time of completion. |
| Start Date | The timestamp on which the job was initiated. |
| End Date | The timestamp when job ended. |
| Run time | Total running duration of the job. |
| Status | Status of the job. For example, Success, Running, and Failed. |
| Actions | You can perform the following actions, namely: Restart: For failed jobs, you can restart the jobs with failed tables or all the tables. Cancel: For the currently running jobs, you can stop the job run. |
Viewing Failed Onboarding Jobs
Operations Analyst dashboard enables you to view the log files for the failed onboarding jobs, which helps you in performing Root Cause Analysis (RCA) and in rectifying the underlying issues.
To view logs for a failed onboarding job:
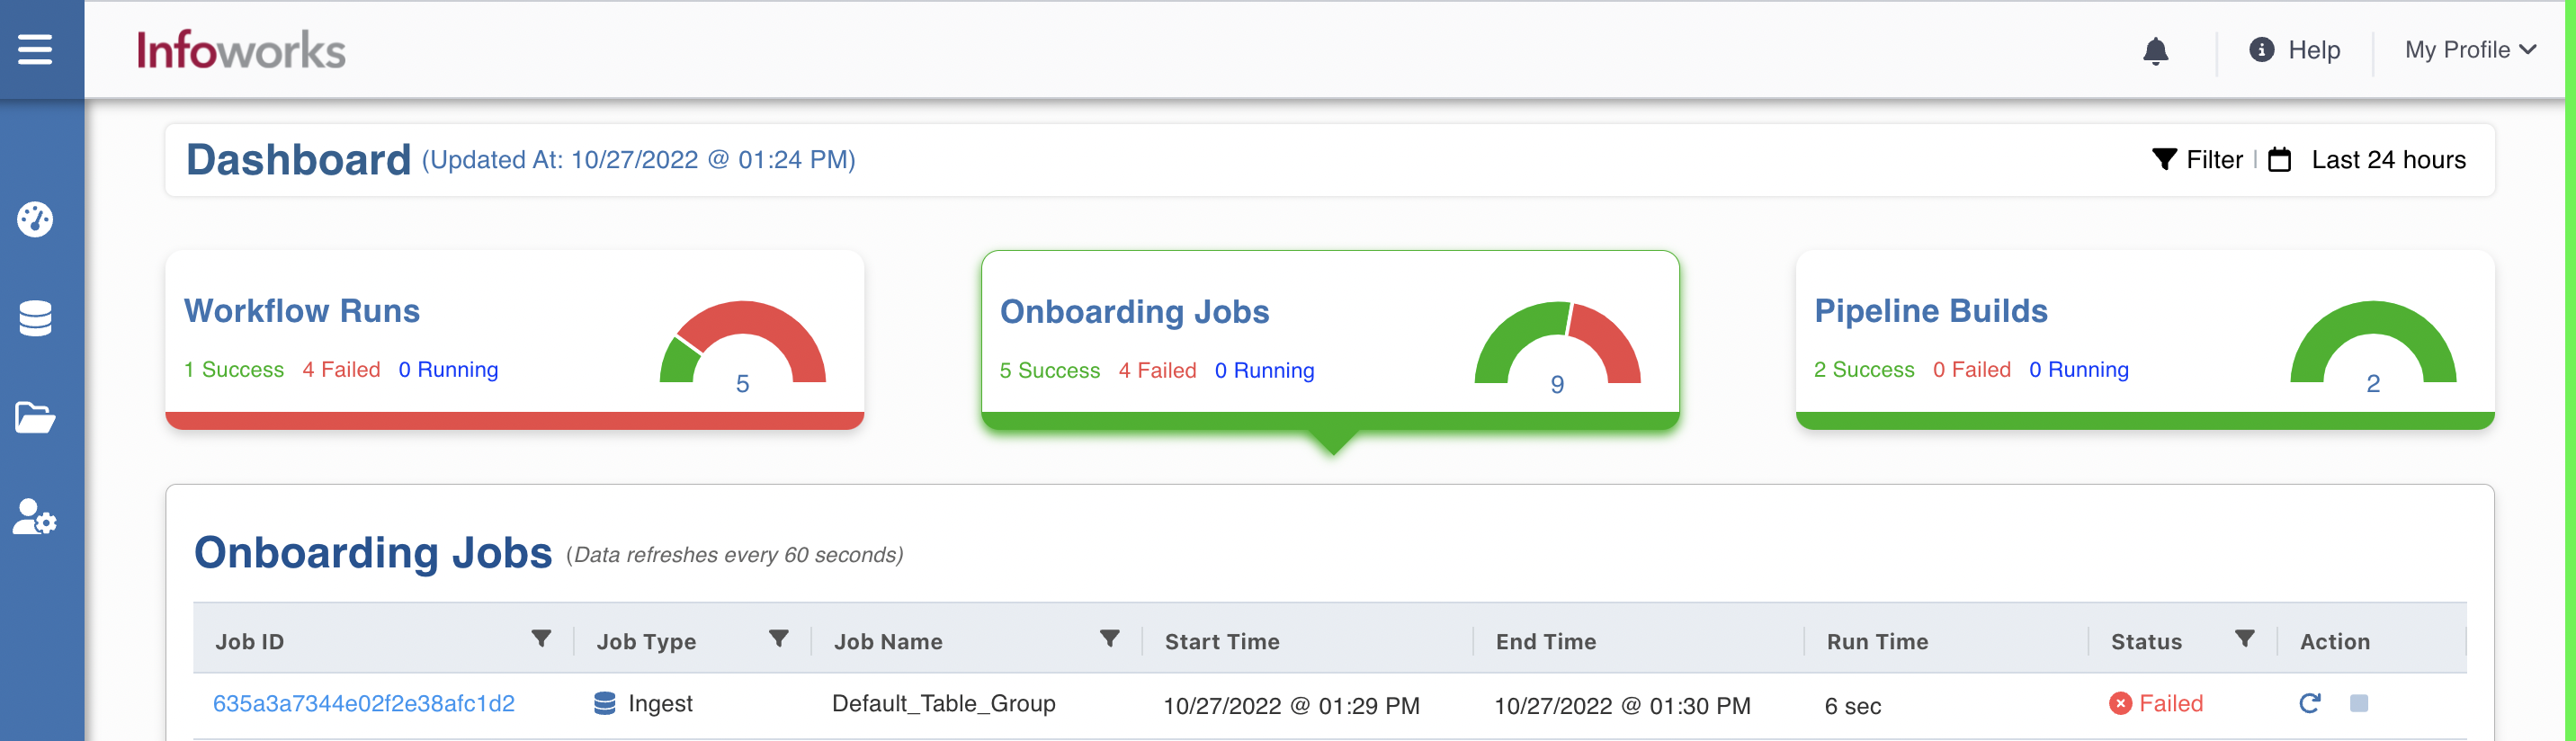
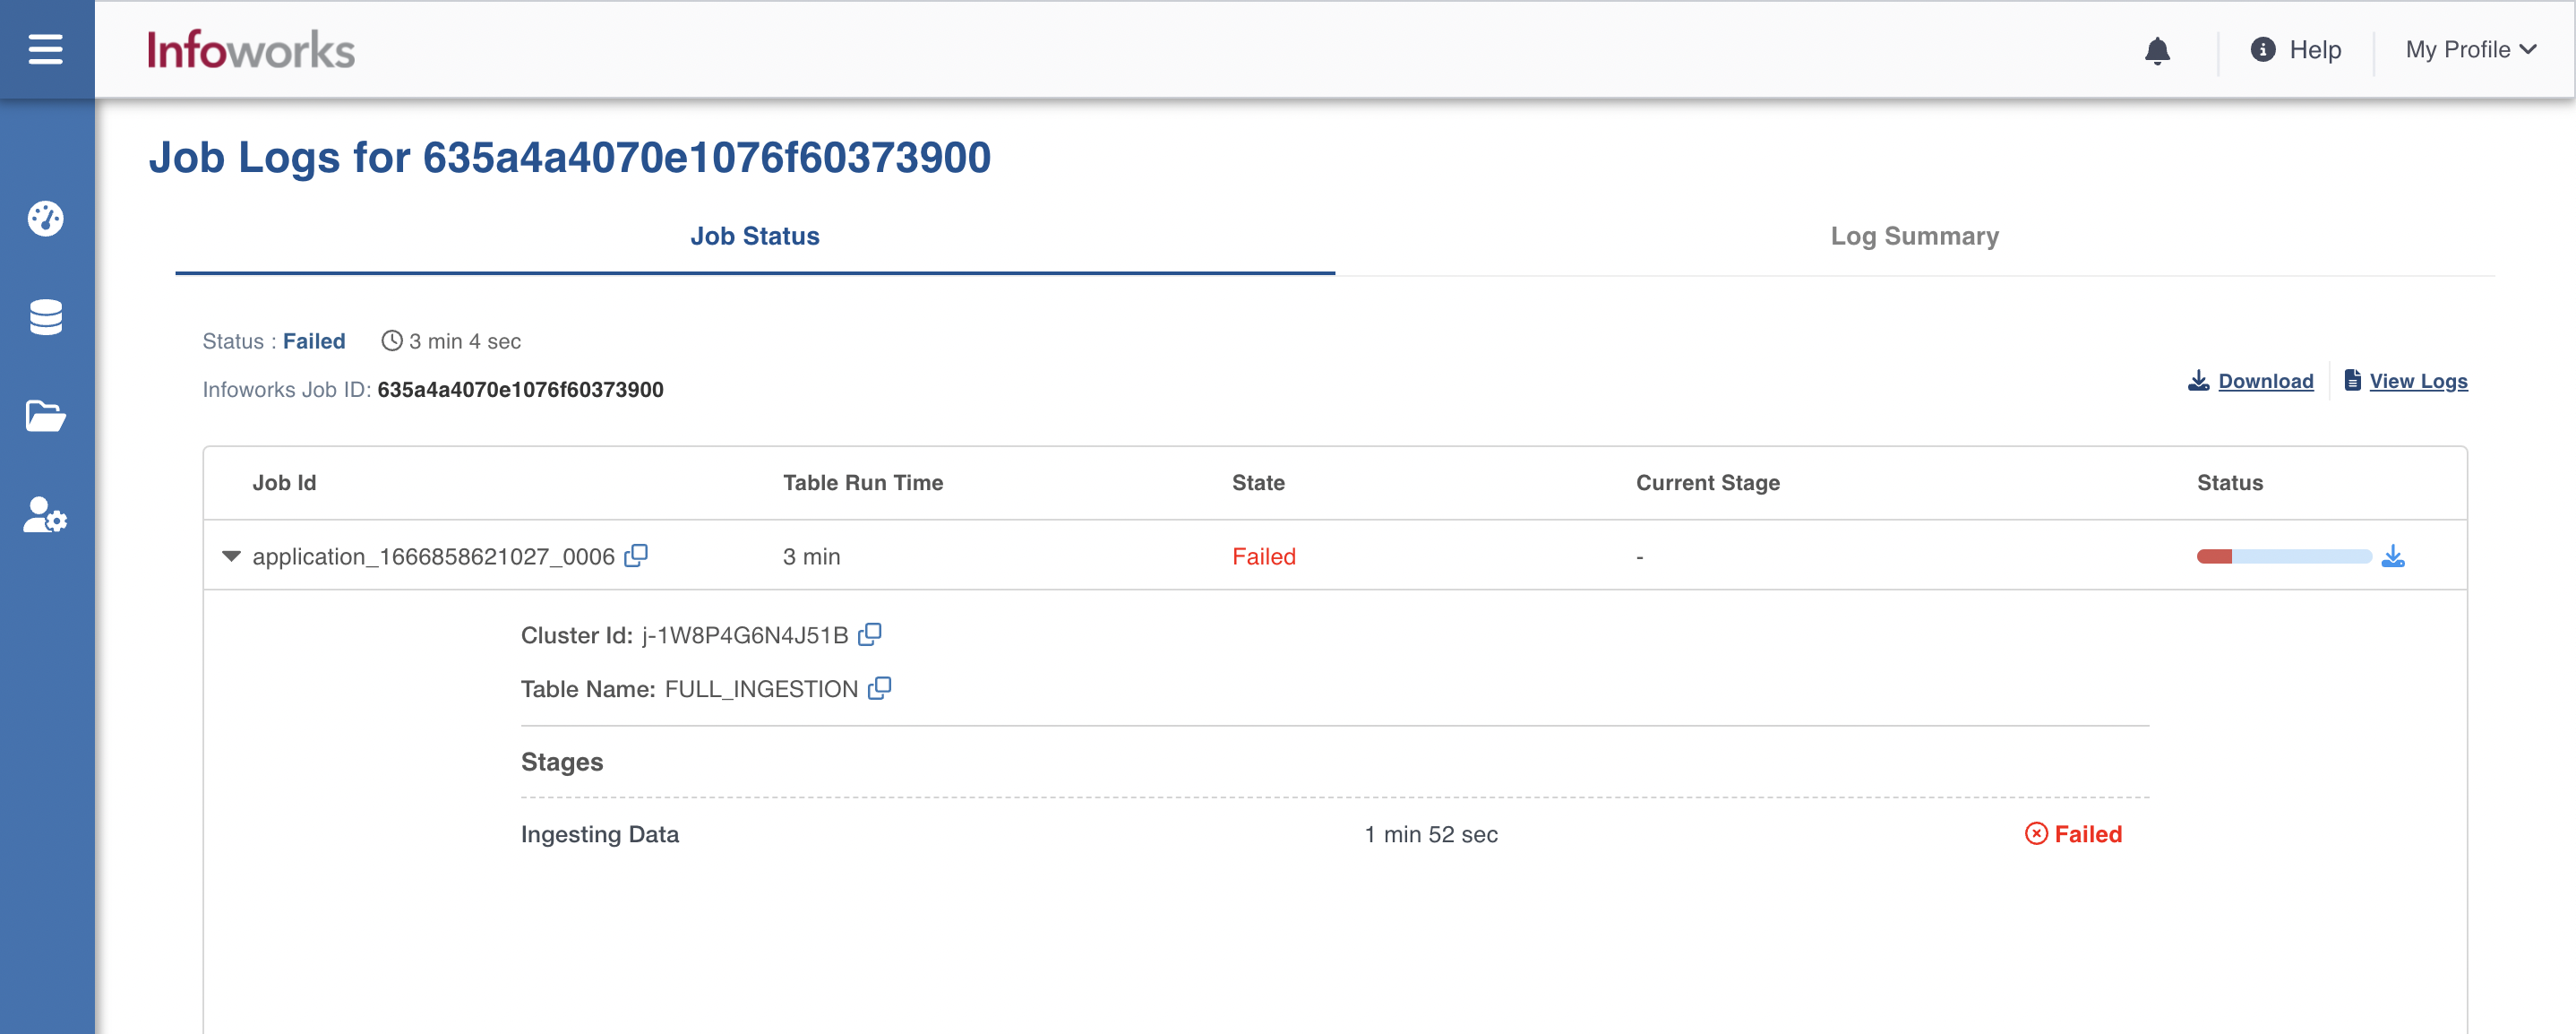
Step 1: Click any failed onboarding job. The Onboarding Job Logs overview page appears.
Step 2: Under the Job Status tab, if you want to download job logs that failed from control plane, click the Download button. Similarly, if you want to download job logs that failed from data plane, click the Download icon which appears under the Status column.
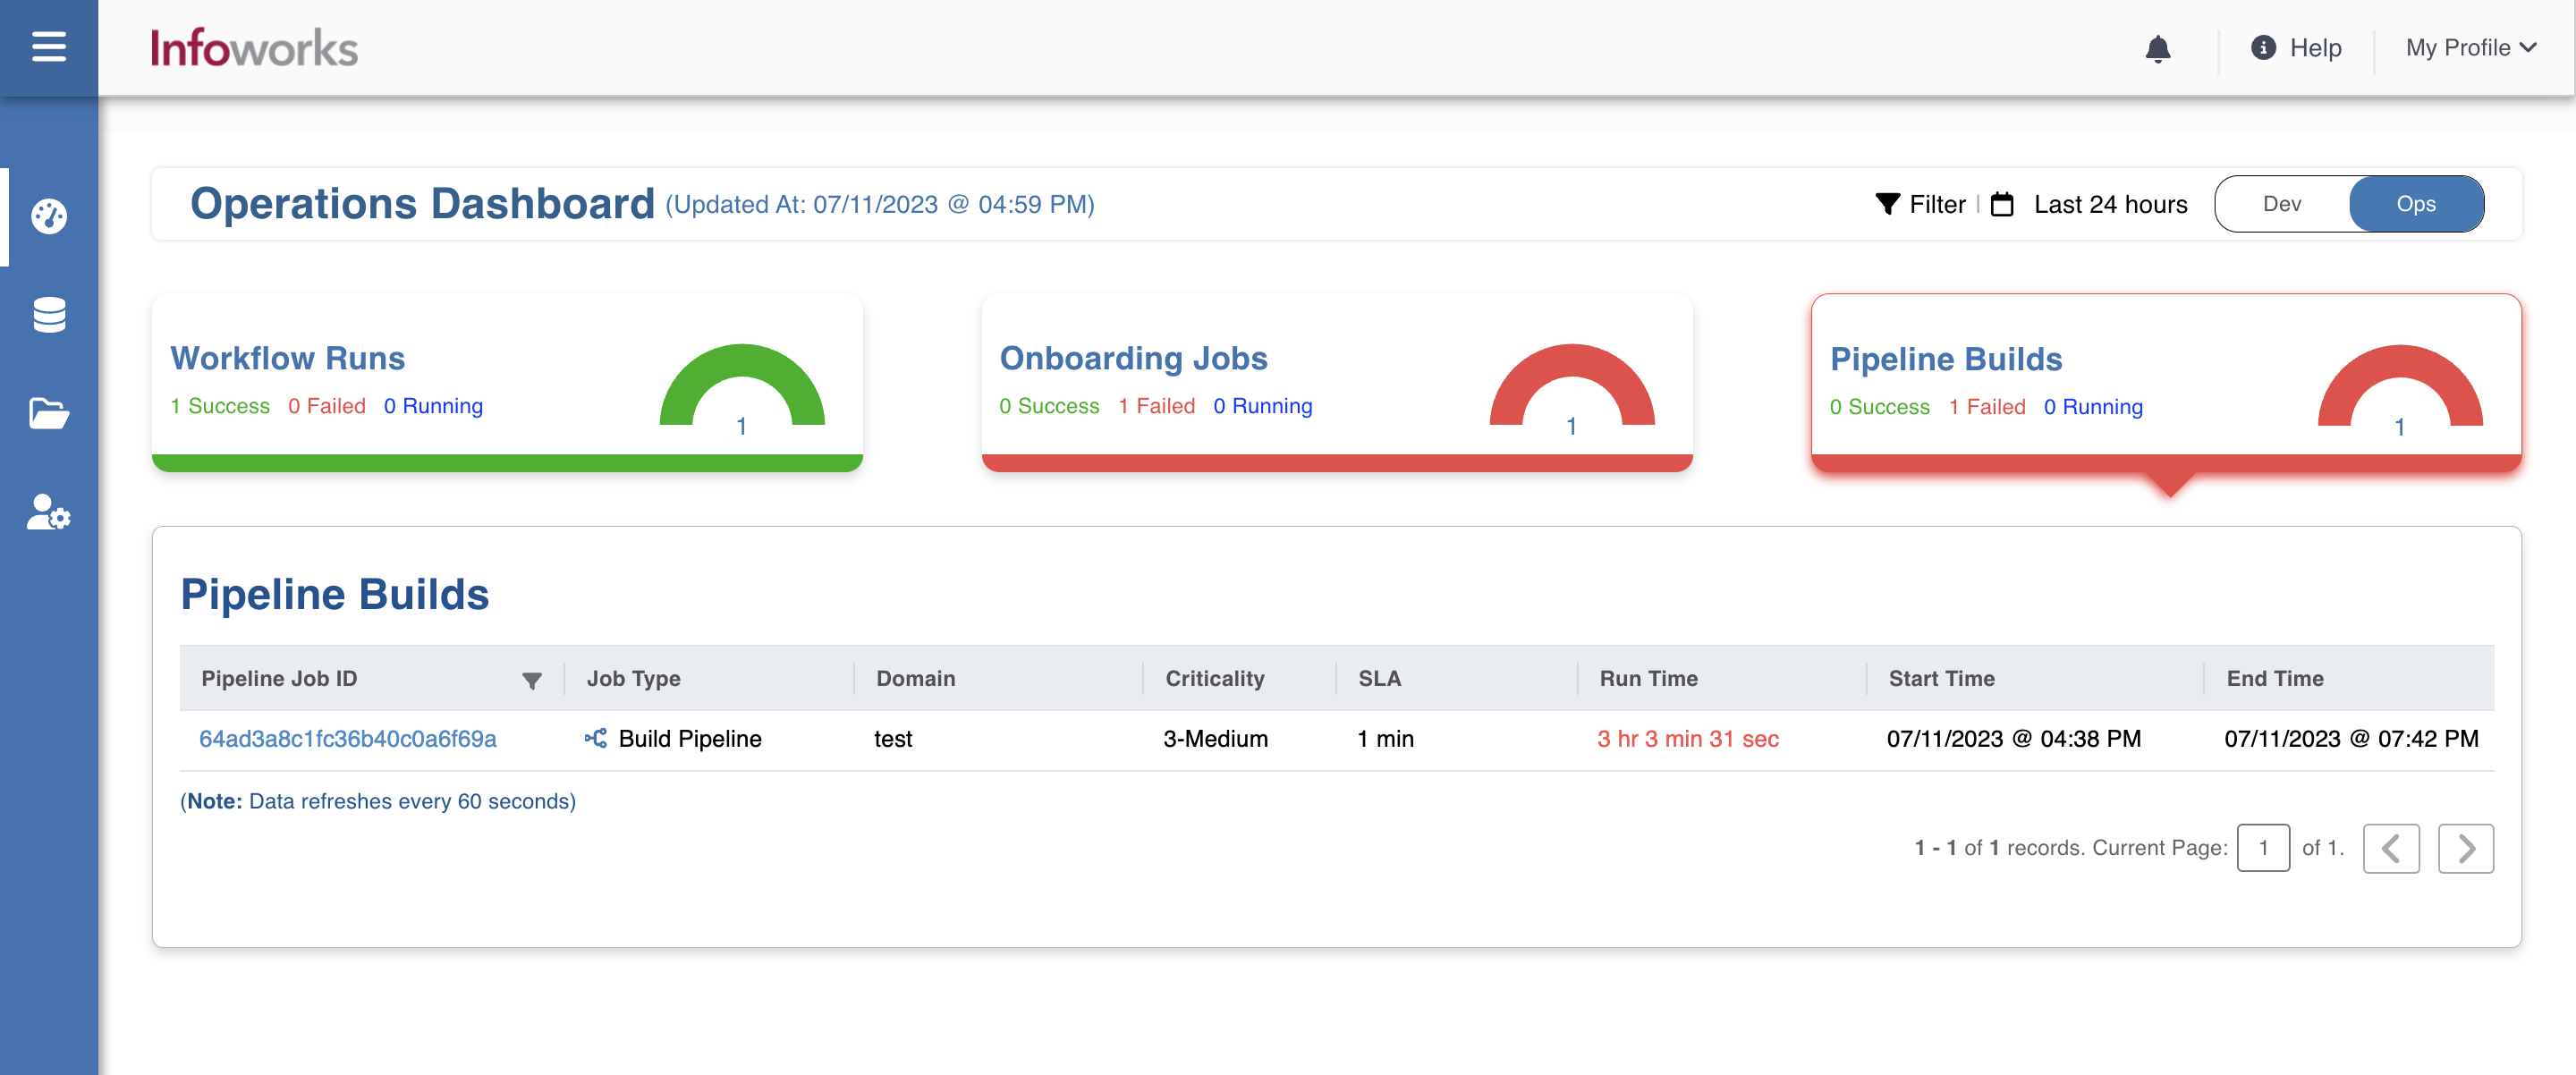
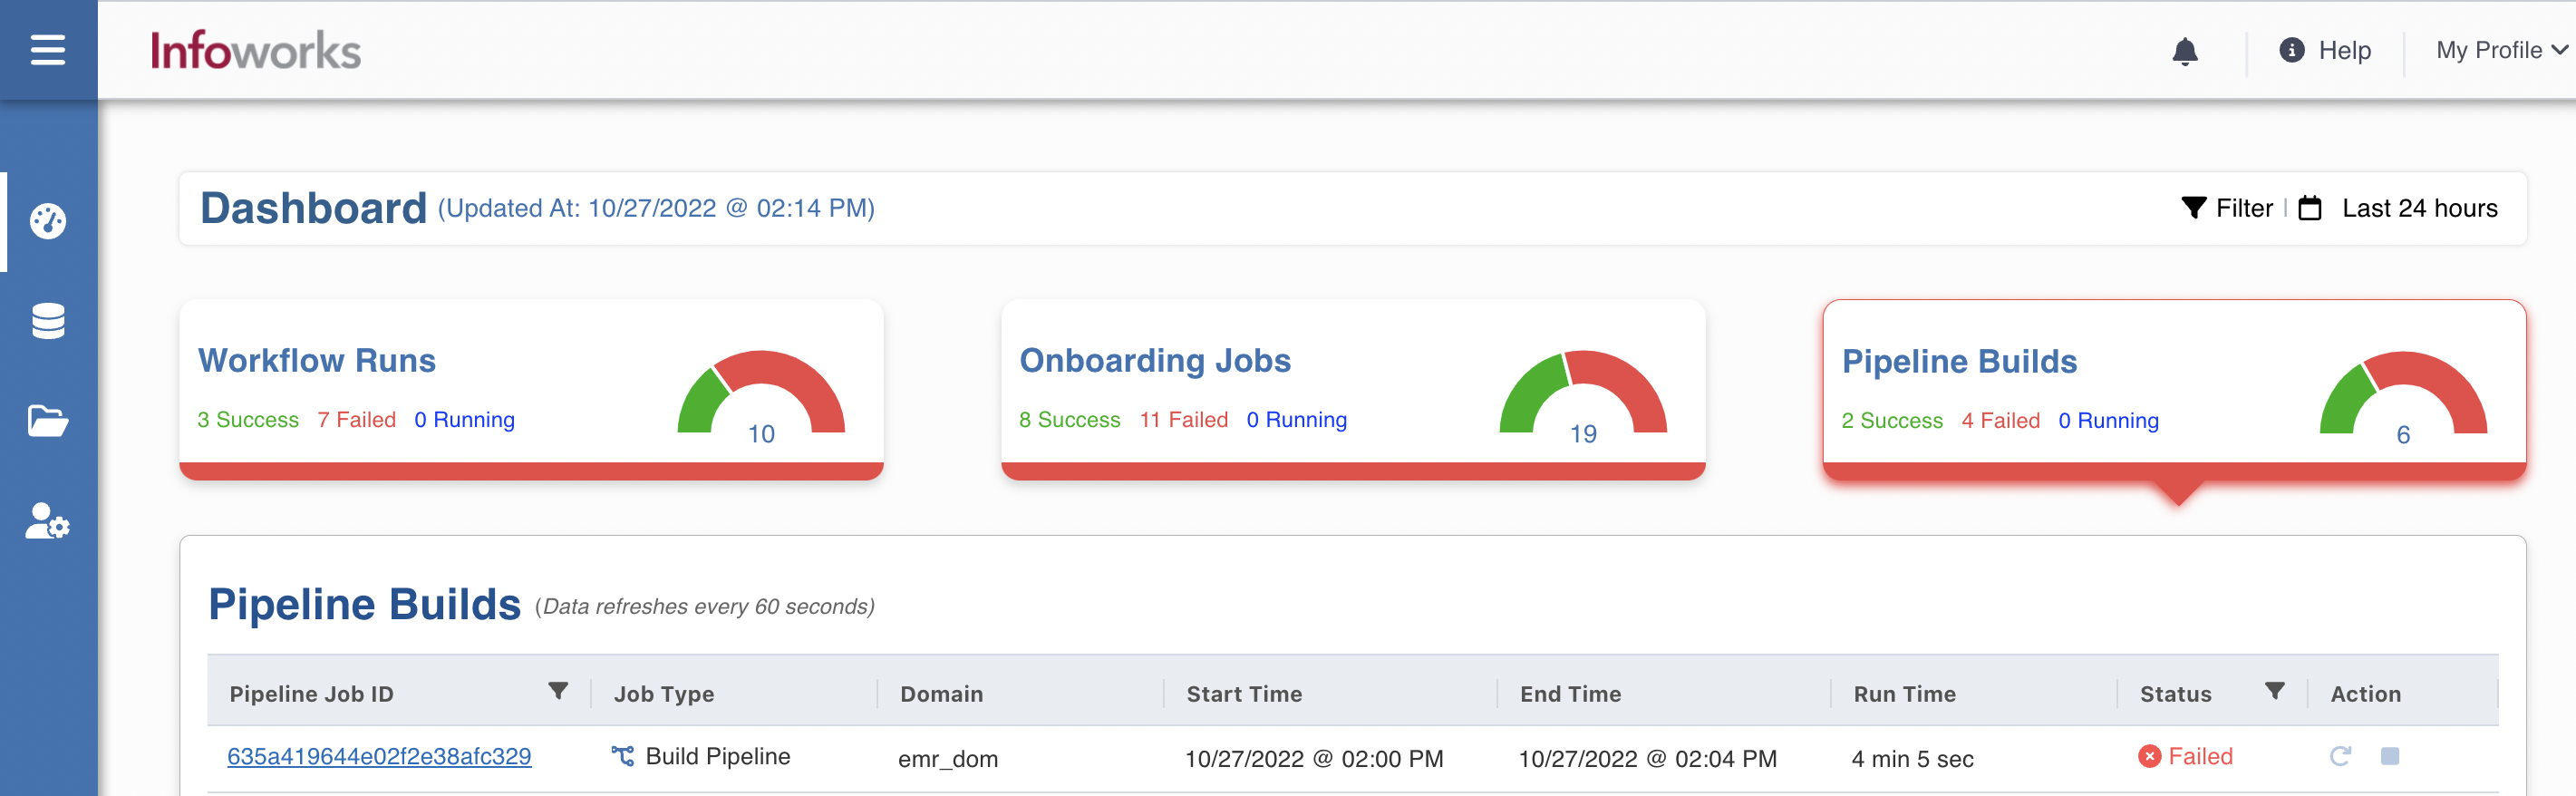
Pipeline Builds
Pipeline jobs widget will show build pipeline jobs.
| Field | Description |
|---|---|
| Pipeline Job ID | Unique ID assigned to the pipeline job. |
| Job Type | It is set to Build Pipeline for all |
| Domain | The domain this pipeline job belongs to |
| Criticality | Configured criticality on respective workflow in SLA configuration. |
| SLA | Expected time of completion. |
| Start Date | The timestamp on which the job was initiated. |
| End Date | The timestamp when job ended |
| Run time | Total running duration of the job |
| Status | Status of the job. For example, Success, Running, and Failed |
| Actions | You can perform the following actions: Resubmit: For failed jobs, you can resubmit the job run Cancel: For the currently running jobs, you can stop the job run. |
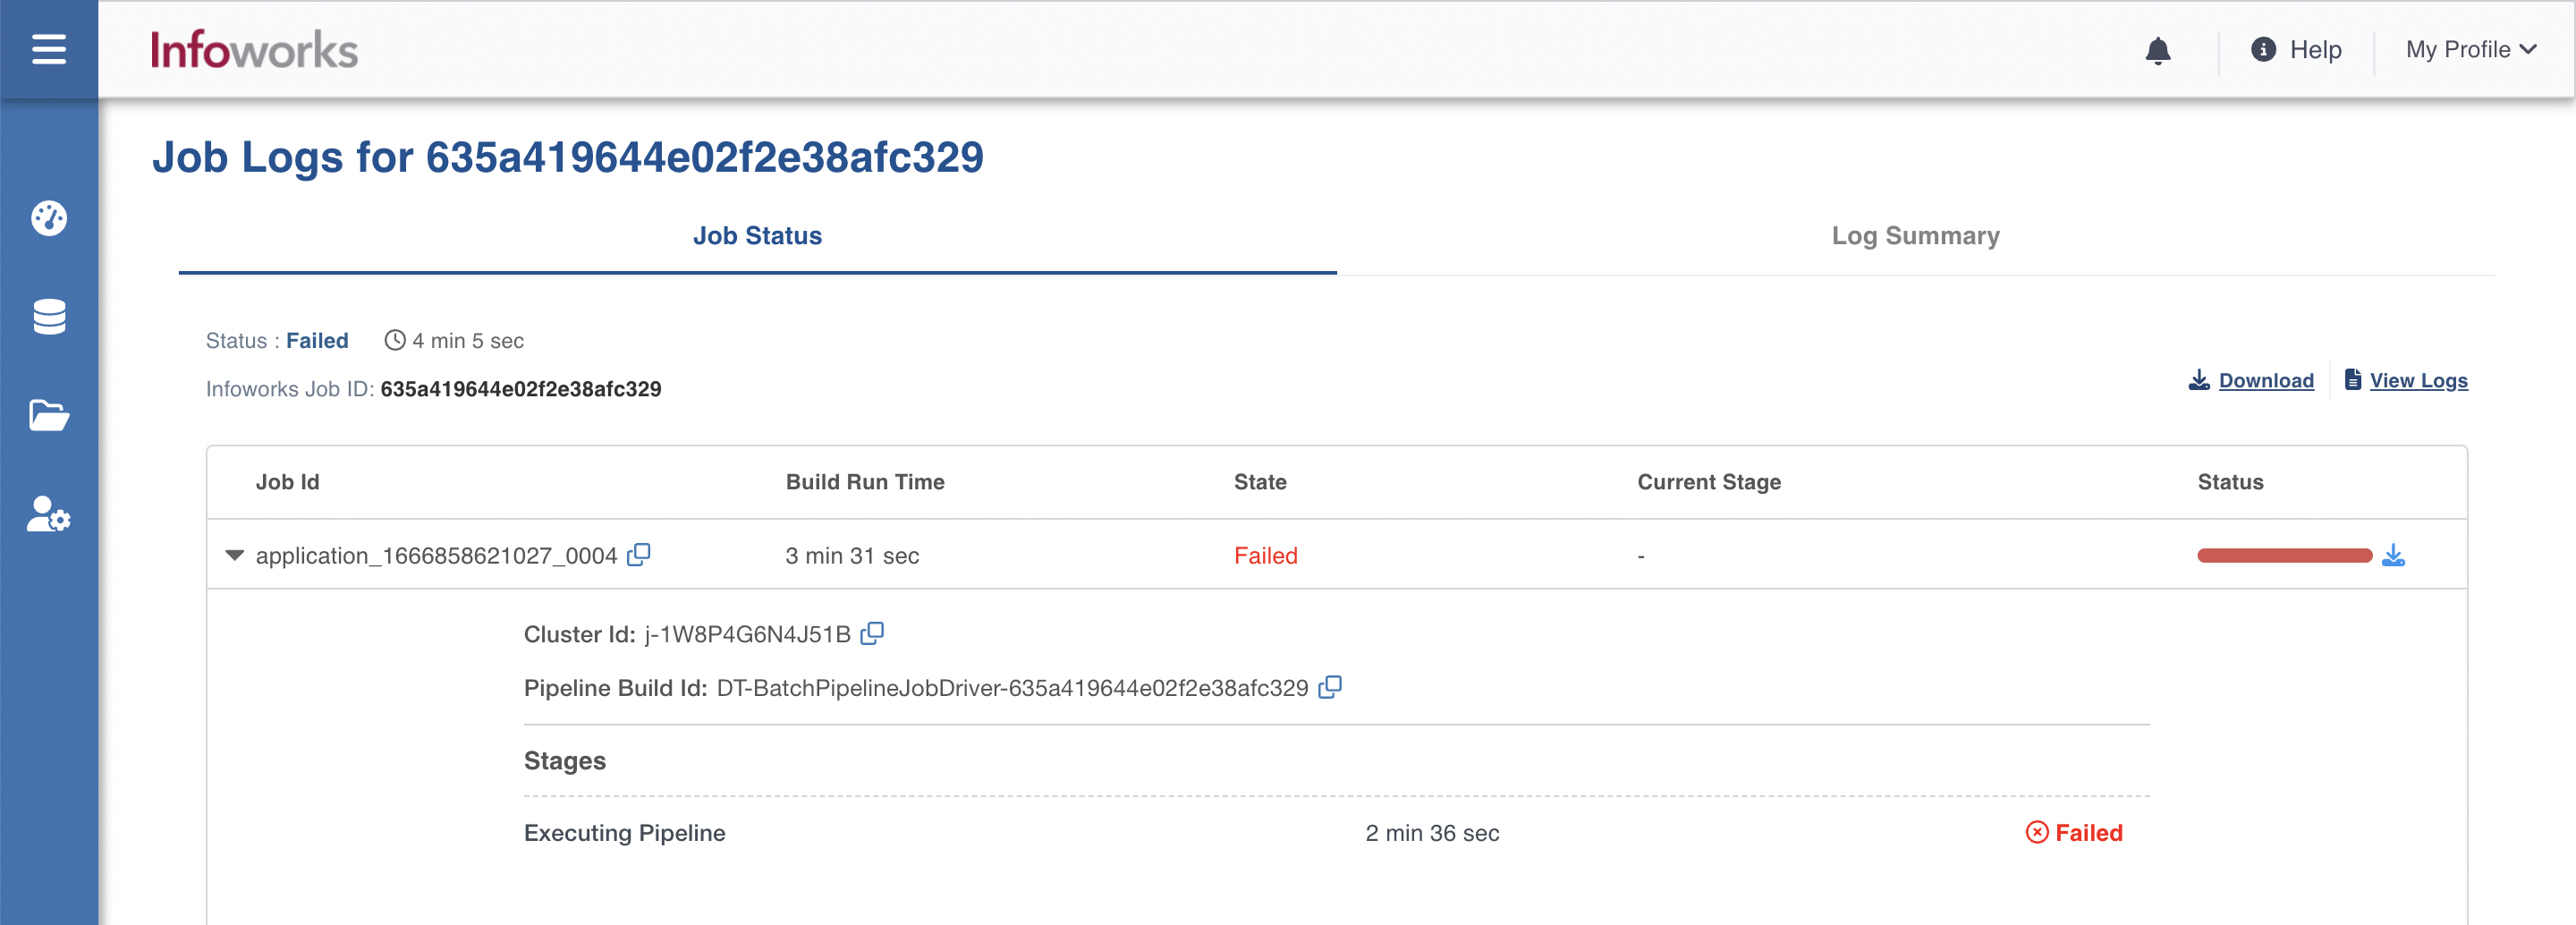
Viewing Failed Pipeline Builds
Operations Analyst dashboard enables you to view the log files for the failed pipeline builds, which helps you in performing Root Cause Analysis (RCA) and in rectifying the underlying issues.
To view logs for a failed pipeline builds:
Step 1: Click any failed pipeline build. The failed Pipeline Build overview page appears.
Step 2: Under the Job Status tab, if you want to download job logs that failed from control plane, click the Download button. Similarly, if you want to download job logs that failed from data plane, click the Download icon which appears under the Status column.
Advanced Filters
There are advanced filters available to filter the jobs based on domains and sources. It helps them to quickly identify problem areas, such as failed workflows and jobs, large number of anomalies, jobs that are taking longer than usual, etc. To see how the dashboard looks for an Operations Analyst, refer to the below given image.
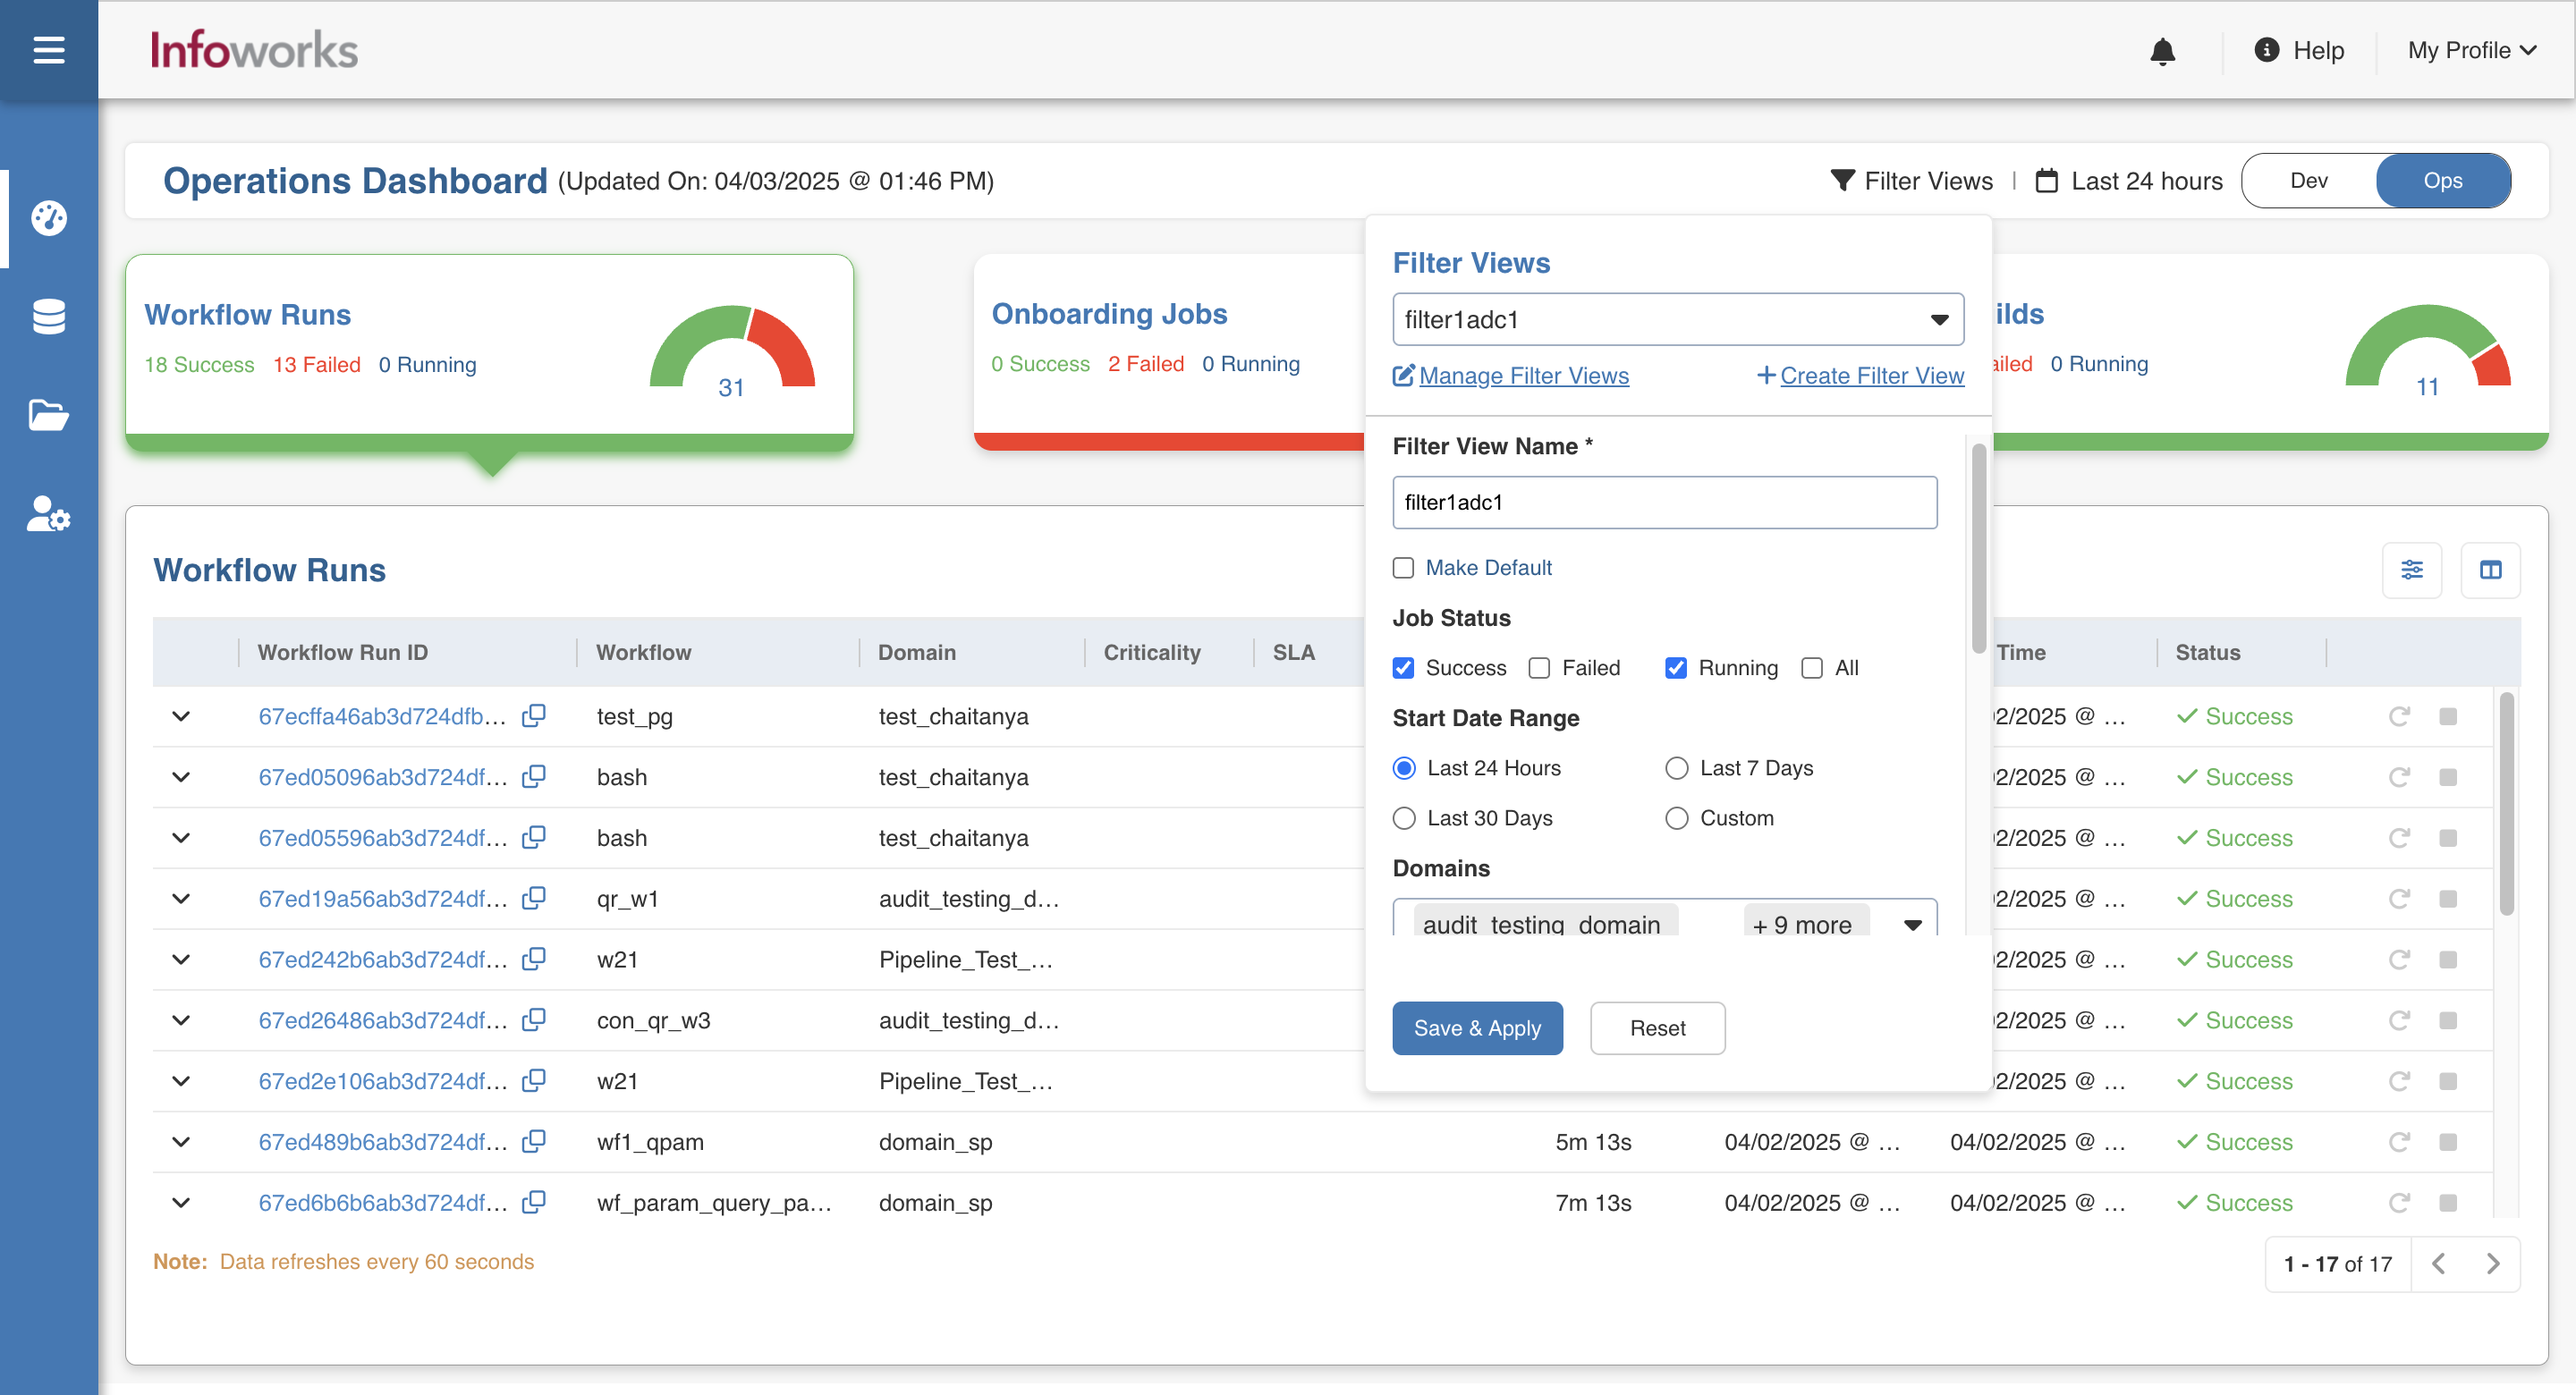
For more information, refer to the following filter fields.
| Field | Description |
|---|---|
| Filter Views | Allows users to create and save preconfigured filter sets, eliminating the need to repeatedly apply the same filters. If multiple filter views are created, users can designate one as the default view for easier access. |
| Filter View Name | Displays the name of the selected filter view. |
| Make Default | To set the filter view as default. |
| Job Status | Filters the workflows/jobs based on the status, such as Success, Failed, Running, and All. |
| Start Date Range | Filters based on timestamp range, such as Last 24 hours, Last 7 days, and Custom. |
| Domains | Filters workflows and pipelines based on domain name. |
| Sources | Filters onboarding jobs based on source name. |
| SLA Status | Filters based on SLA missed or on-time. |
| Run Time | Filters based on the duration of the job/workflow. |
| Criticality | Filters based on criticality. |
For generic information regarding dashboards, refer to the Dashboard section.
Currently, the Operations Dashboard displays only seven days of data for custom date range selection. For other options, we show all the data.