Infoworks monitoring service is a part of the Infoworks platform used to monitor the resource utilization of the system and application in the Infoworks edge node. The service collects different metrics like CPU usage, memory usage, disk usage and application status and displays graphs on the dashboard.
It provides both realtime and historic views of resource utilisation of the system and application.
This service also supports sending alerts and notifications via email or slack when a service or system alarm is raised. For example, you can set the service to send alerts when the disk is full or exceeds some threshold.
Infoworks Monitoring System processes the collection of routine data that measures progress of Infoworks operations, and its periodic tracking. The data is systematically gathered and analysed to track changes in program outputs and performance over time. It also provides alerts, feedback, and early indications of progress (or lack of progress). Its purpose is to permit the management and stakeholders to make informed decisions regarding the effectiveness of programs and the efficient use of available resources.
The Operations dashboard is automatically set up during the installation of Infoworks using the provisioning service.
After setting up the dashboard, perform the following steps:
Navigate to <Infoworks Host IP>:3022 to log in to the Infoworks Operation dashboard in one of the following three modes:
Admin: Allows addition of users, and configuration of data and alert queries.
Viewer: Allows only viewing of different tabs in the dashboard.
Editor: Allows configuration of data and alert queries.
Admin users can add new users in any of these available modes.
NOTE Contact support@infoworks.io for admin user credentials.
The Home Dashboard appears on successful login.
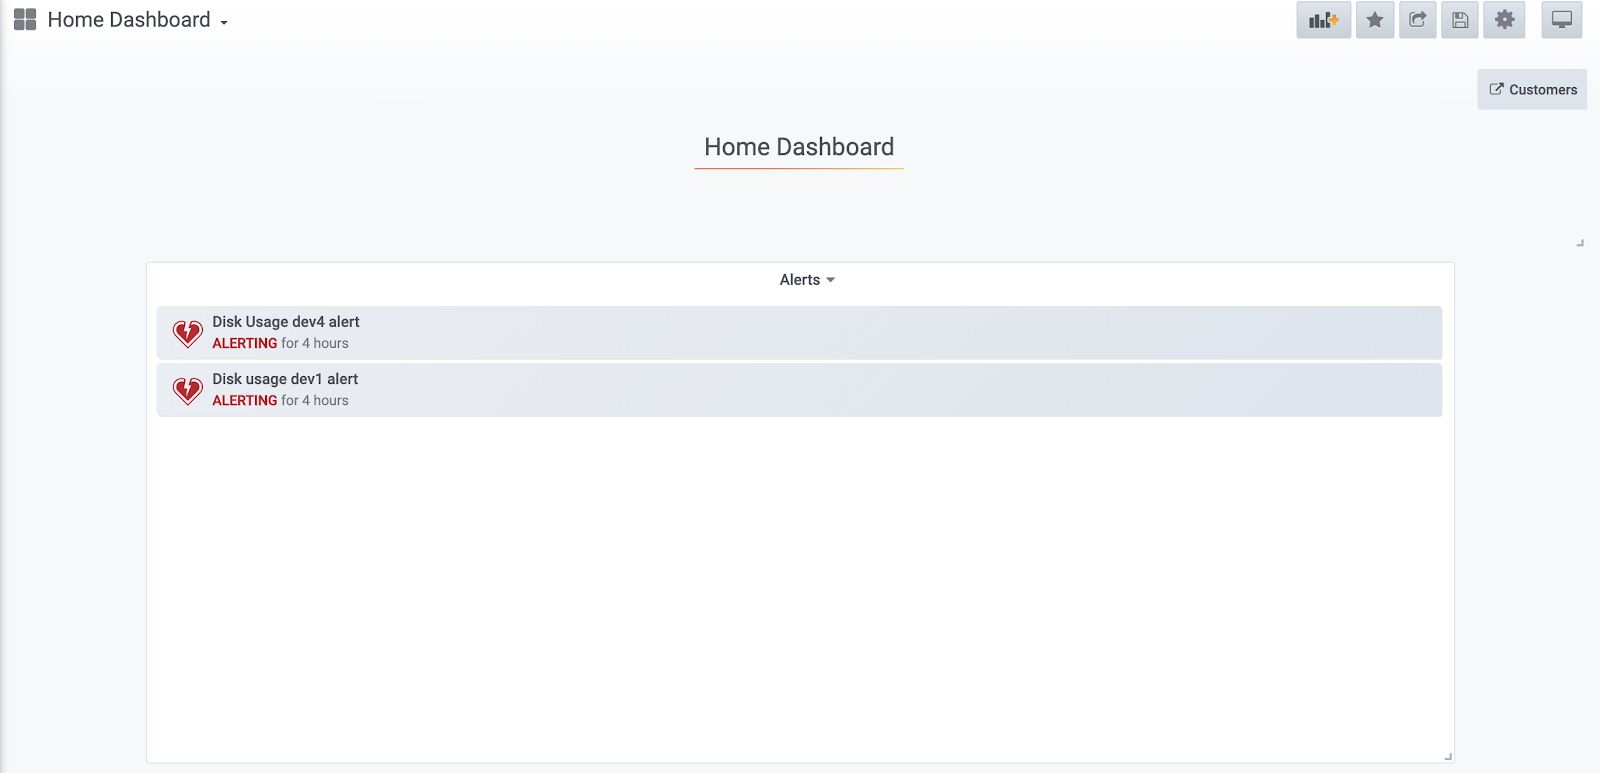
Click on the alerts displayed to view the corresponding details. The following tabs are available in the Infoworks Operational dashboard.
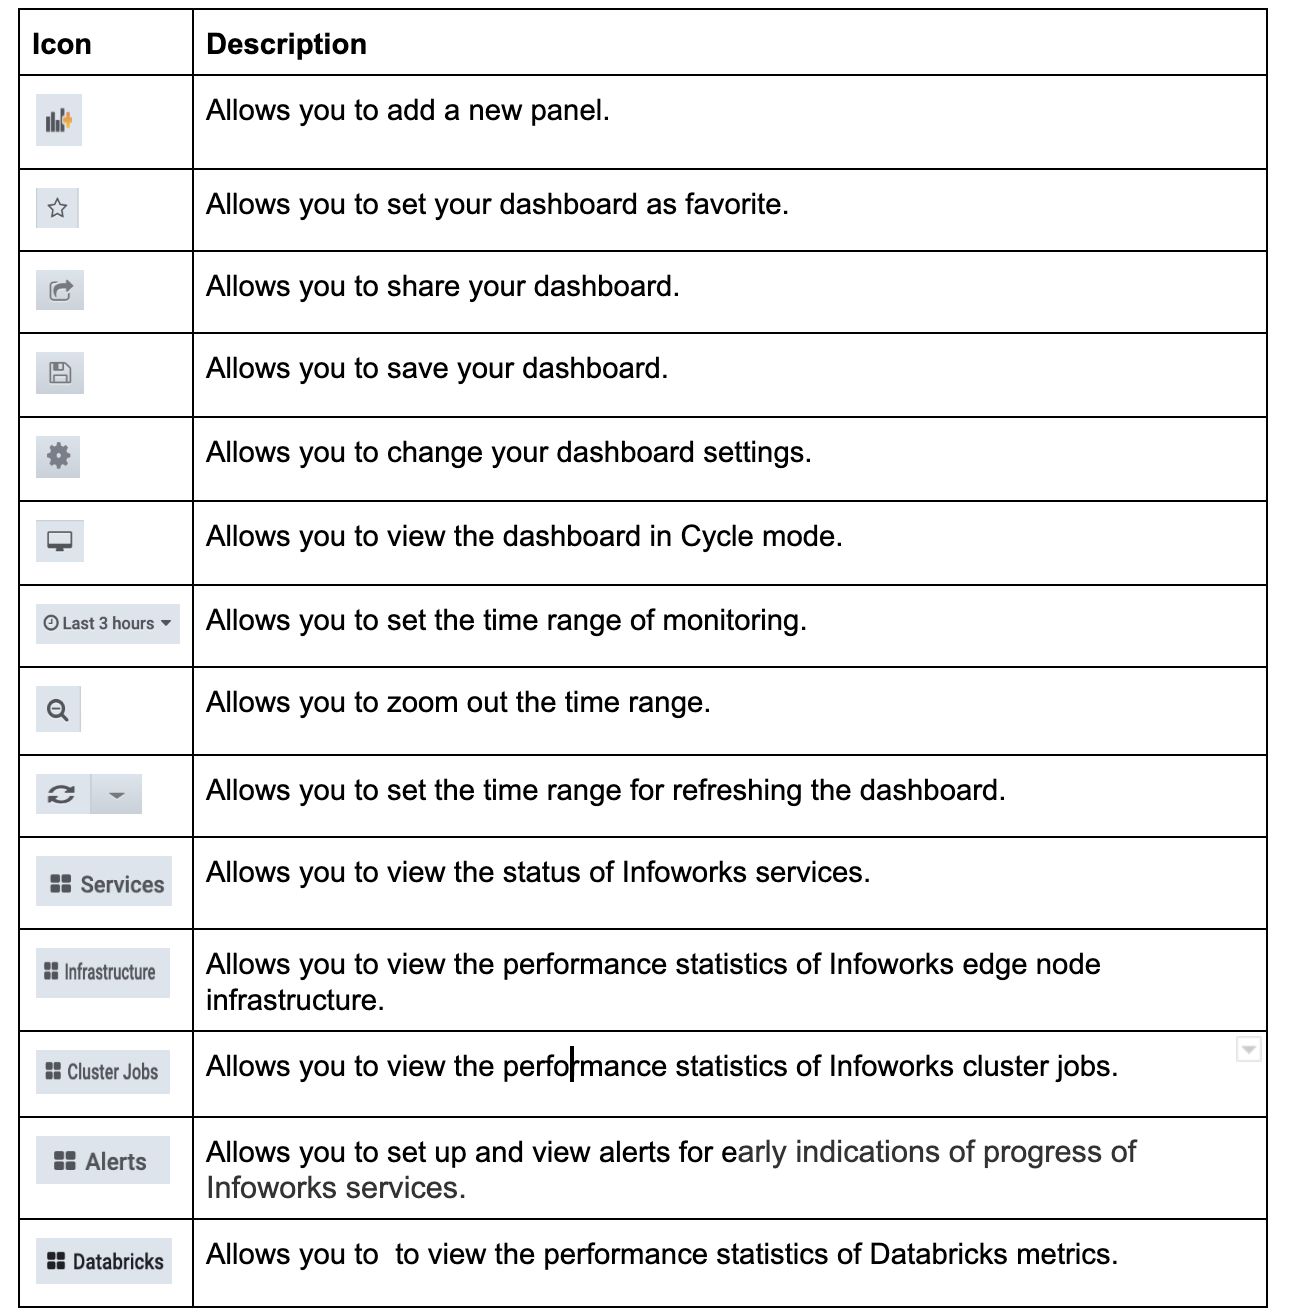
Choose the tab you wish to view. All the tabs in the Infoworks Operational dashboard are enhanced with time-based filters, customizable refresh durations, and so on. The following describes all the available icons on the top right corner:
Services
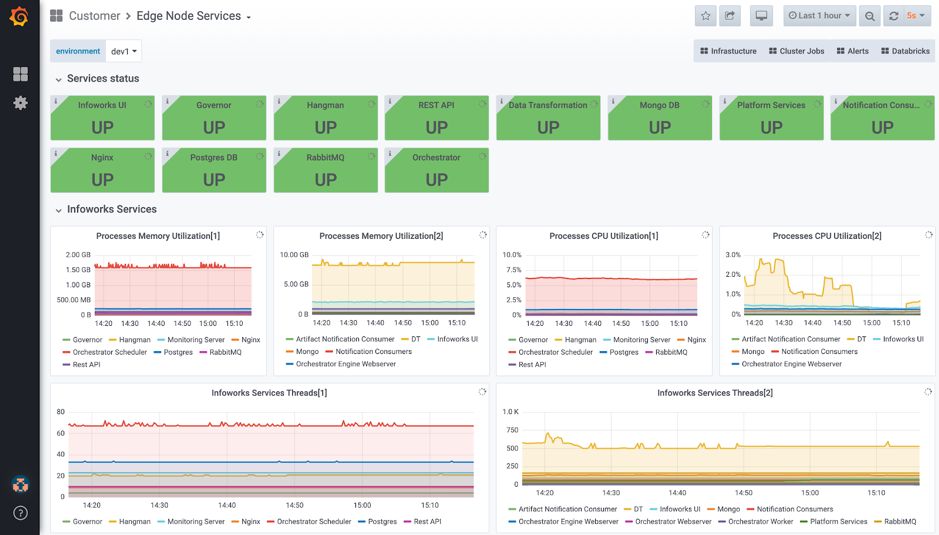
This tab displays performance statistics such as memory utilization, CPU utilization and service threads of Infoworks edge node services. This consists of two sections:
Services Status: Displays the running status of the following Infoworks services such as Infoworks UI, Governor, Hangman, REST API, Data Transformation, Mongo DB, Platform Services, Notification Consumers, Nginx, Postgres DB, Query Service, RabbitMQ, and Orchestrator. Green colour indicates that the service is up and running. Yellow colour indicates that some parts of the services are running. Red colour indicates that the respective service is down.
Infoworks Services : Graphically displays the performance statistics such as memory utilization, CPU utilization, and Infoworks services threads of Infoworks services.
You can filter the services statistics using the environment filter added at the top of the Edge Node Services tab.
Cluster Jobs
This tab displays the following data of Infoworks cluster jobs:
You can filter the cluster job statistics using the environment, application, and job ID filters added at the top of the Cluster Jobs tab.
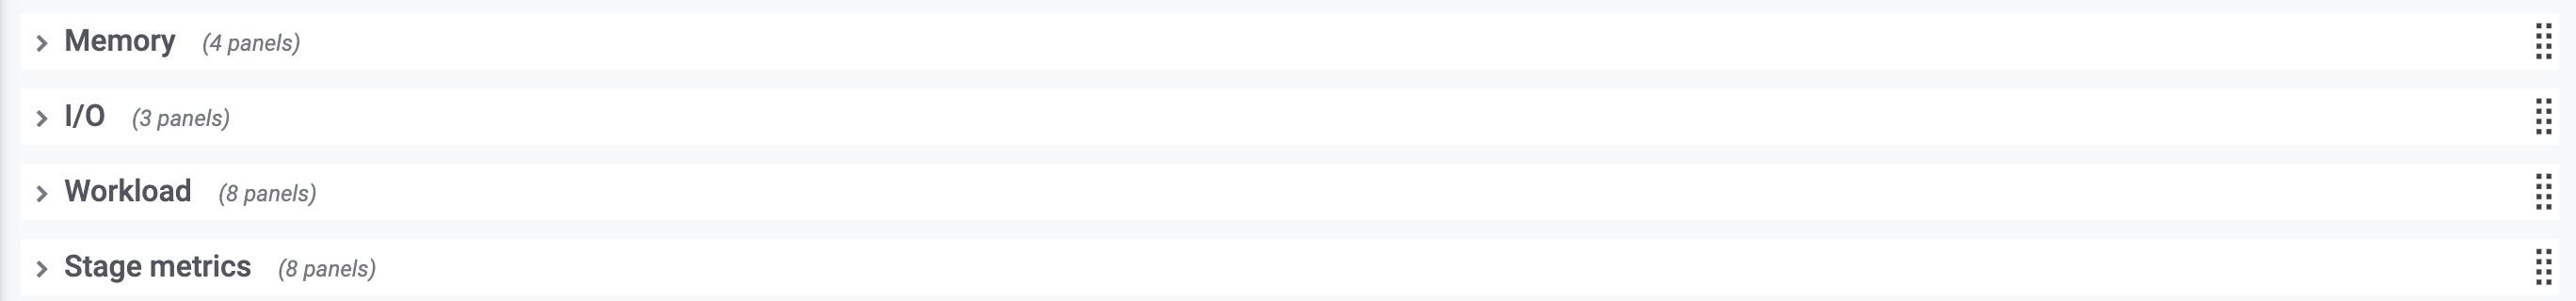
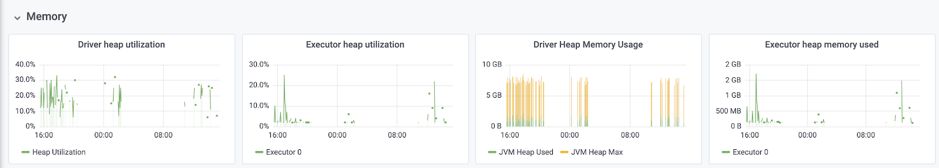
Memory
This section displays heap utilization and heap memory used of drivers and executors.
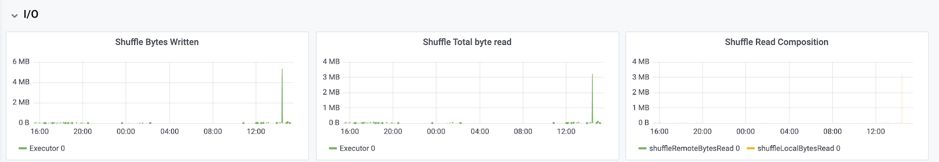
Input/Output
This section displays shuffle bytes written, read and shuffle read compositions.
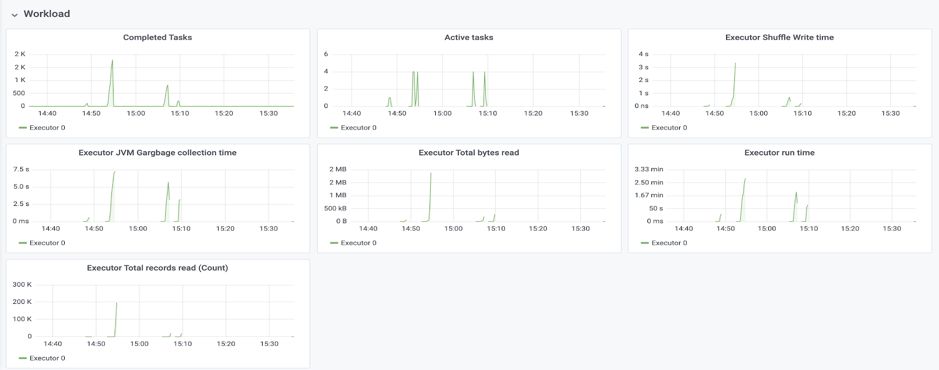
Workload
This section displays active and completed tasks, along with executor parameters such as shuffle write/run time, bytes read, JVM garbage collection time, and total records read.
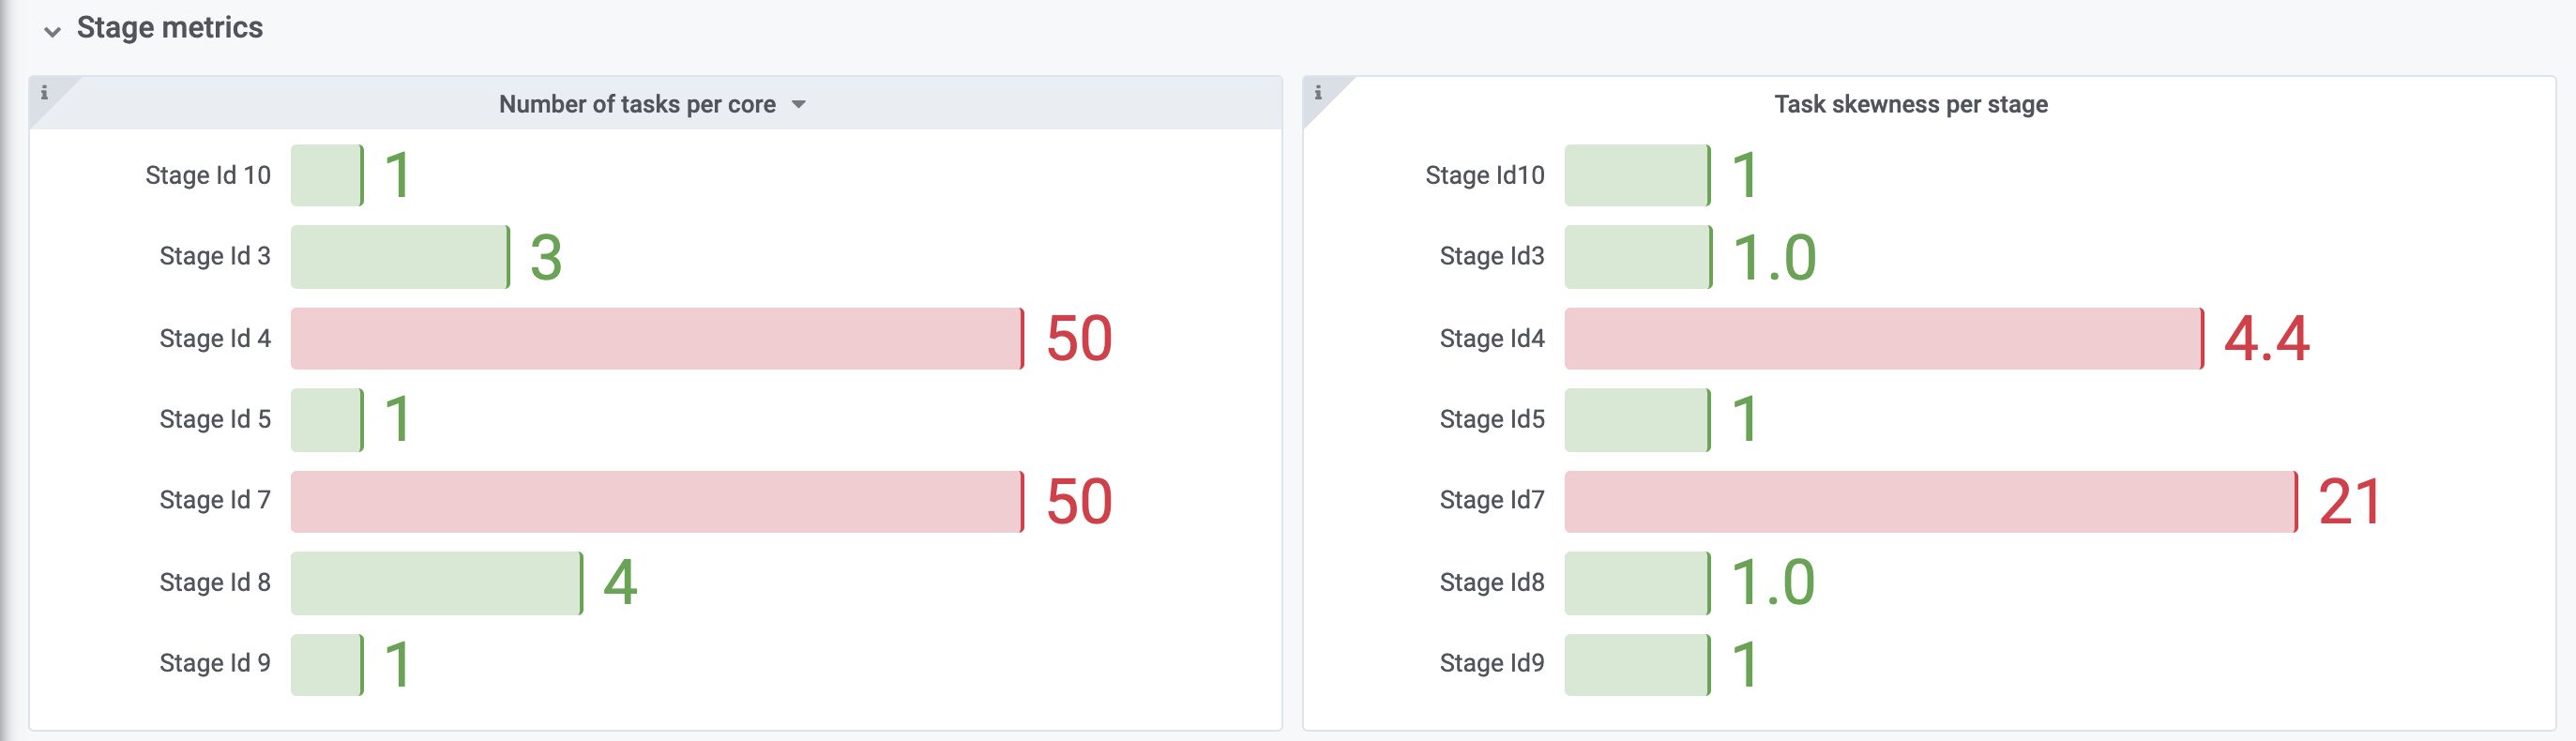
Stage Metrics
This section displays number of metrics per stage level of the job. Metrics includes number of tasks run per core, task skewness per stage , wall clock time, one core compute hours used, and bytes read and written .
Infrastructure
This tab displays the real-time visualisation of performance data of the underlying infrastructure of Infoworks, such as system uptime, total RAM/Disk, virtual CPUs, Disk/CPU/Memory utilization, and so on.
You can filter the infrastructure statistics using the environment filter added at the top of the Edge Node Infrastructure tab.

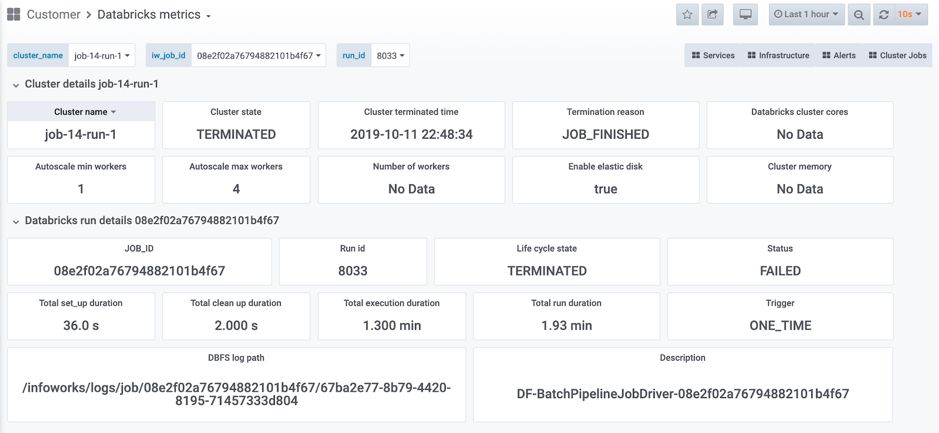
Databricks Metrics
This tab displays the run details of Infoworks jobs such as cluster details. Termination details, cluster core details, and so on.
You can filter the Databricks metrics statistics using the cluster name, job ID, and run ID filters added at the top of the Databricks Metrics tab.
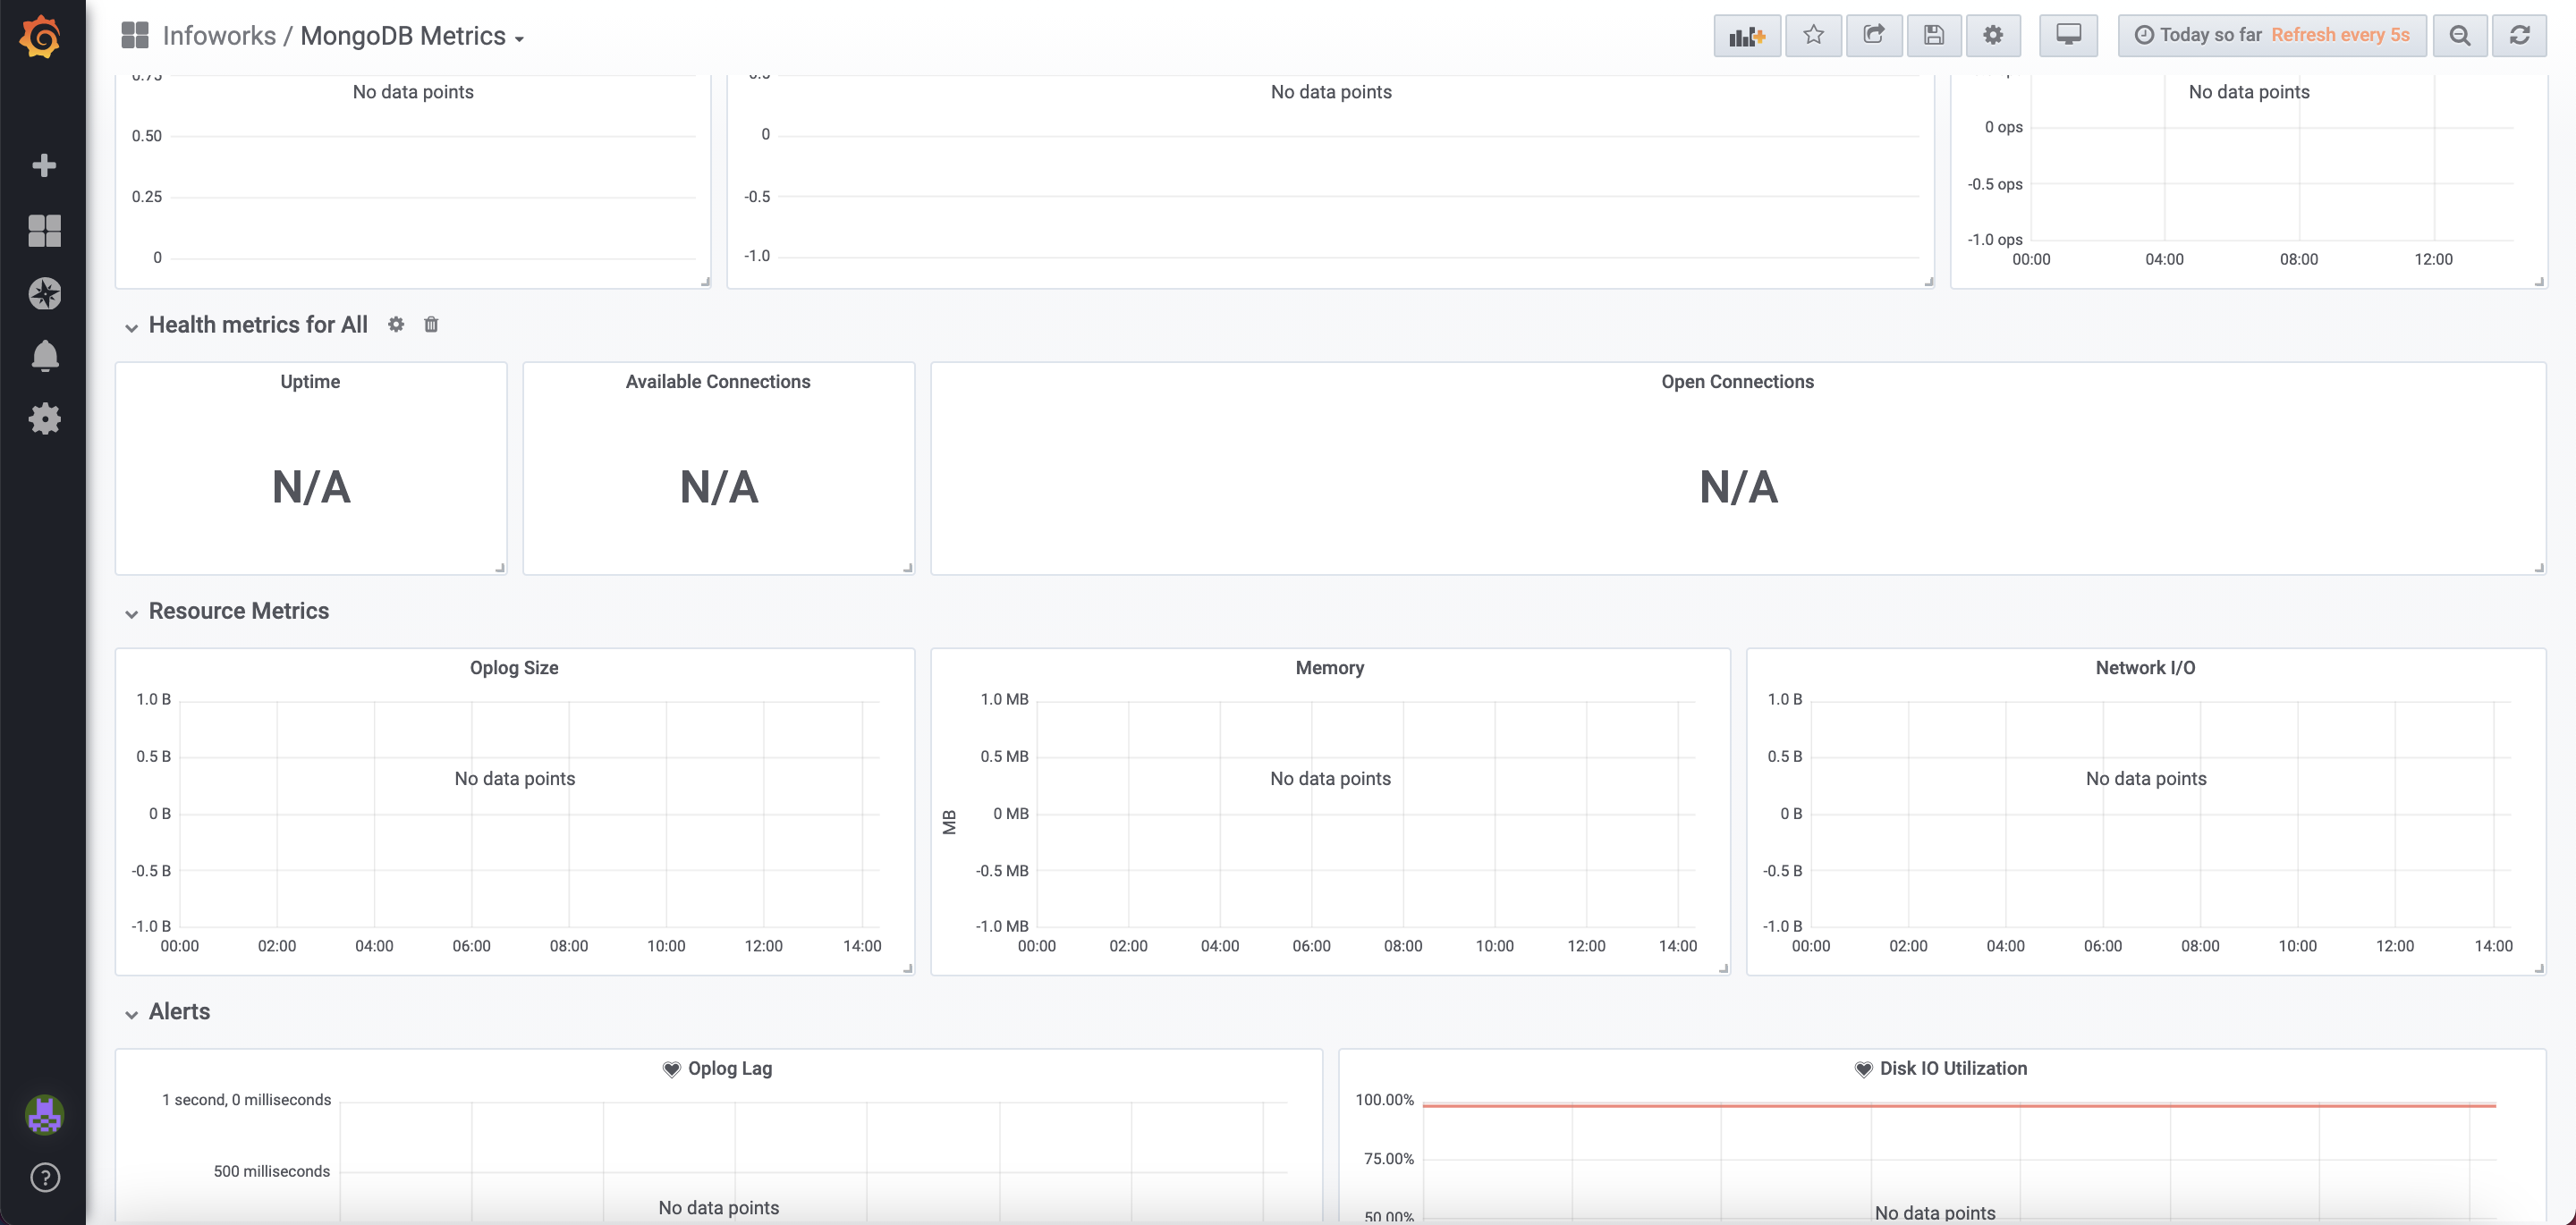
MongoDB Metrics
This tab displays the metrics collected for MongoDB like Query Operations, Document Operations, Document Query Executors etc. It also displays the health metrics, resource level metrics and alerts for MongoDB.