Double-clicking each node displays the following list of settings.
Inputs
The input tab includes the following:
List of all the column details of the node, name of the table (Data Lake) and whether it is included or excluded downstream.
Clicking the icon next to each header displays a Filter text box where you can enter the required value to be filtered.
Clicking the header reorders the rows alphabetically.
Selecting the columns using the checkbox and clicking the Exclude Columns or Include Columns button excludes or includes the columns respectively.
Clicking the Synch Table Schema button synchronizes the input columns of the source node used in the pipeline with the columns in the source table. For more details, see Synchronizing Pipeline Source Schema.
Double-clicking the column name enables a text box to edit/rename the column name. The new column name is validated and checked for duplicates.
Clicking the view column lineage icon next to each column name displays the details of the origin of the column.
Clicking the search for column in the pipeline icon next to each column name displays the list of nodes that the column is included in, within the pipeline.
Transformations
The transformation tab includes the following options:
Derivations
The derivation can be Output or Temporary. Output does not reflect the transformations in the output columns, while Temporary reflects the transformations in the output columns. If an expression generates multiple columns (for example, posexplode or UDF), use the Add Button to add column names to the expression.
For example, the expression, posexplode(array(5,6,7)) AS ('arr_pos','arr_value'), generates multiple columns ('arr_pos' and 'arr_value') and rows in the output.
NOTE These derivations will be applicable on the columns after performing the transformation.
Properties
The configurations to perform transformation.
For loading source data incrementally, see Loading Source Data Incrementally.
For more details on each node, see Performing Data Transformation.
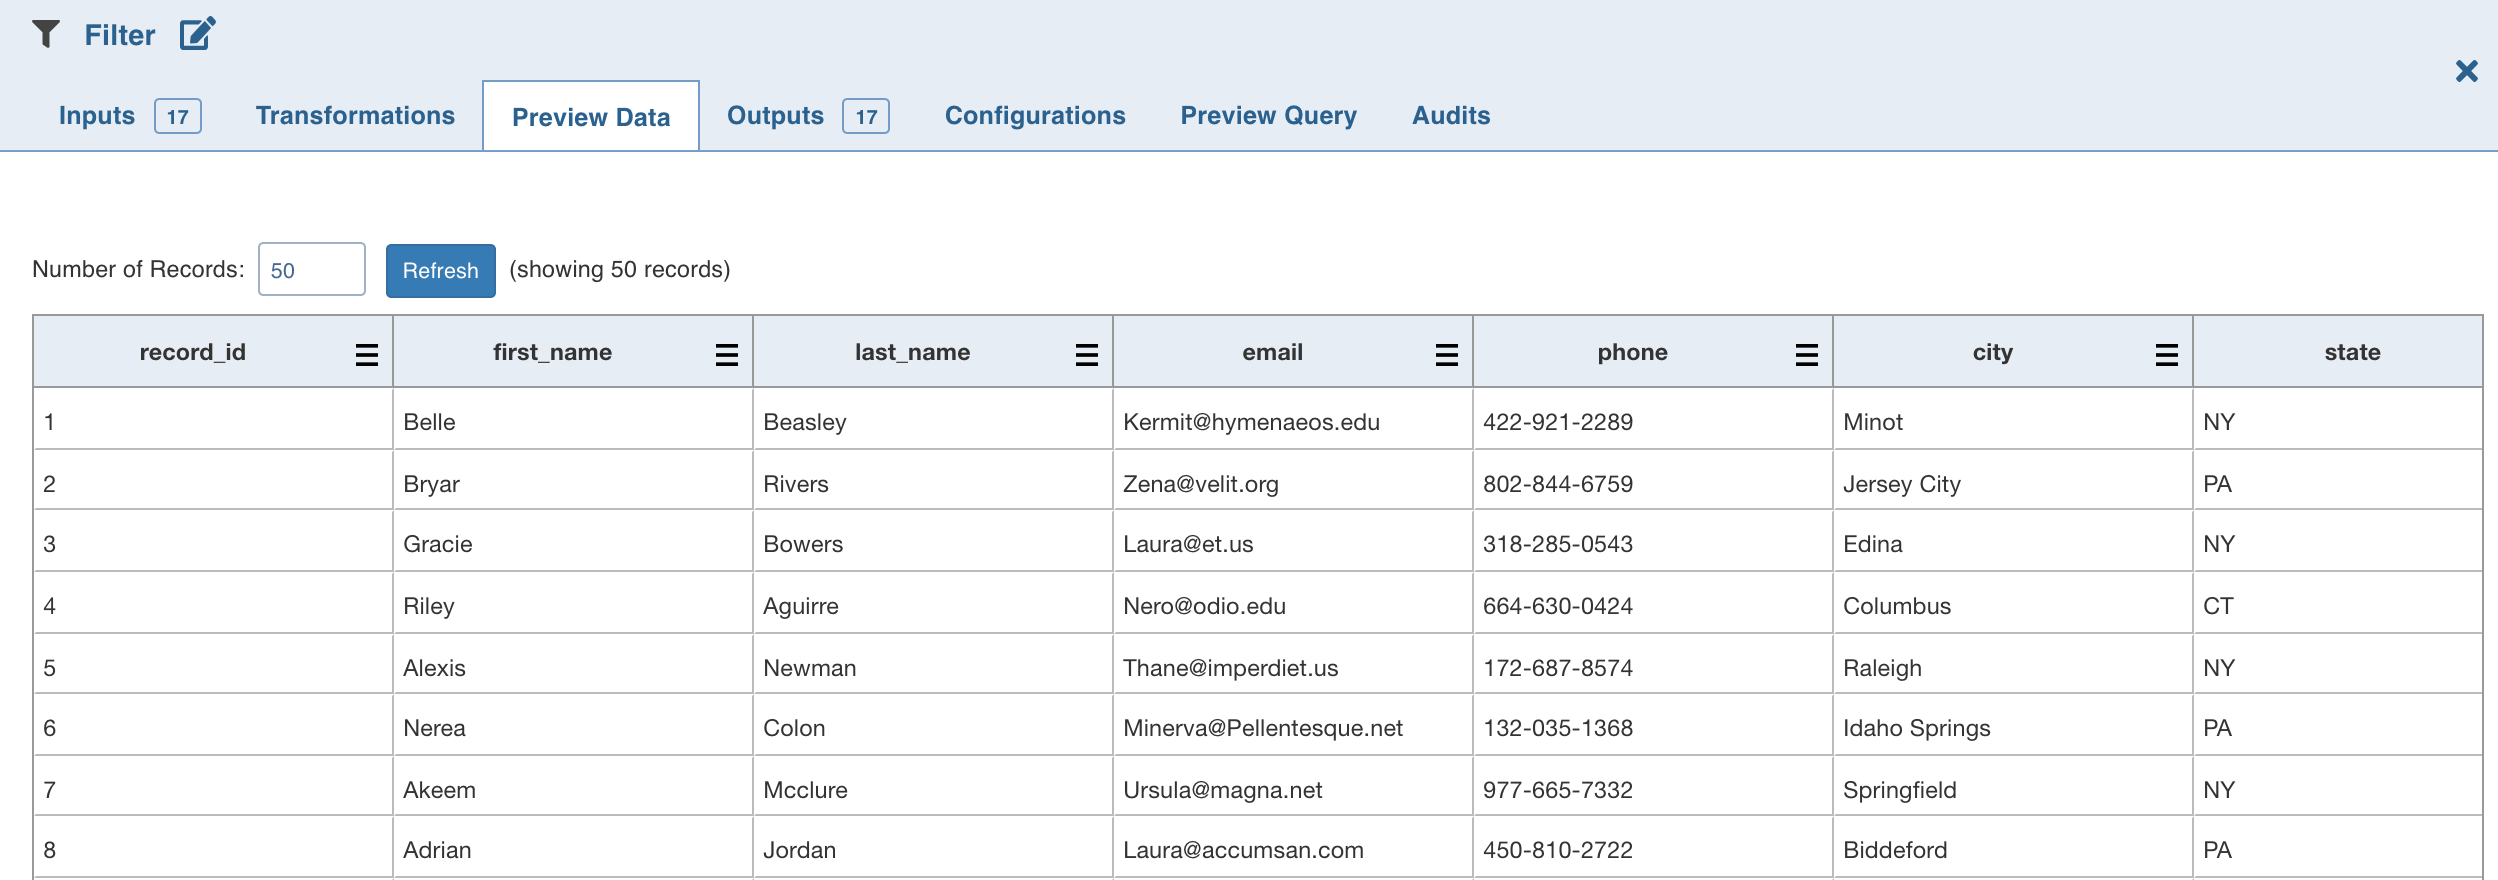
Preview Data
This tab includes sample data for the selected transformation/node. You can click the icon next to the column headers to filter and view the required columns. To rearrange the placement of the columns, drag and drop the column headers towards right or left.
User can choose the dt_interactive_service_cluster setting controls where interactive queries are executed for Databricks Compute:
local (Default): Queries are run using Databricks Connect, utilizing local resources for execution.
databricks: When set to a Databricks cluster, interactive queries are submitted as jobs to the specified cluster, leveraging its compute resources.
This allows users to choose between running queries locally or on a Databricks-managed cluster based on their needs.
Known Issue
Interactive requests may time out if the interactive cluster is not created or any environment issue occurs. Interactive service logs are available in the ${IW_HOME}/logs/dt/ folder. In case of environment issues, fix the issues and then restart interactive service.
For Databricks runtime version 14.3, local mode is not supported.
NOTES
You must restart dt service if the interactive cluster is changed or restarted. When the dt service is restarted, it takes a few minutes to retrieve the first preview data. The subsequent preview data appears in a few seconds.
If the error message "SQL compilation error: Database '"iw_dt_workspace_db"' does not exist or not authorized." appears, please give permission to iw_dt_workspace_db or specify a different database for pipeline preview data.
It takes about 5 minutes for the interactive service to come up in the case of
dt_interactive_service_cluster=databricks.To switch between Databricks and local, user must restart config service, dt service and the interactive cluster post update of conf.properties.
Outputs
This tab includes the list of output columns of the transformation performed on the inputs.
Double-clicking the column name enables a text box to edit/rename the column name. You can also use the Rename Column button. The new column name is validated and checked for duplicates.
Clicking the Remove Columns button allows you to remove the selected columns.
Clicking the icon next to each header displays a Filter text box where you can enter the required value to be filtered.
Clicking the header reorders the rows alphabetically.
Clicking the view column lineage icon next to each column name displays the details of the origin of the column.
Clicking the search for column in the pipeline icon next to each column name displays the list of nodes that the column is included in, within the pipeline.
Configurations - Post Processing
NOTE This tab is available only for Spark pipelines.
You can edit the configurations for each node.
Click the Edit Configurations button and check the Enable Repartitioning option to configure the properties for repartitioning columns, setting the number of partitions, and sorting columns.
The post processing configuration allows you to dynamically partition the output of a node for subsequent node processing. It includes the Repartitioning and Sorting options.
Repartitioning Columns
You can select a list of columns. The columns with unique values will be partitioned into a single set. For this subsequent downstream node, processing will be faster based on the partitioned data. You can select any column which is a part of the Outputs.
Sorting Columns
Once data is partitioned, you can sort the data in the columns within the partition. This enables faster data access and data processing in downstream nodes.
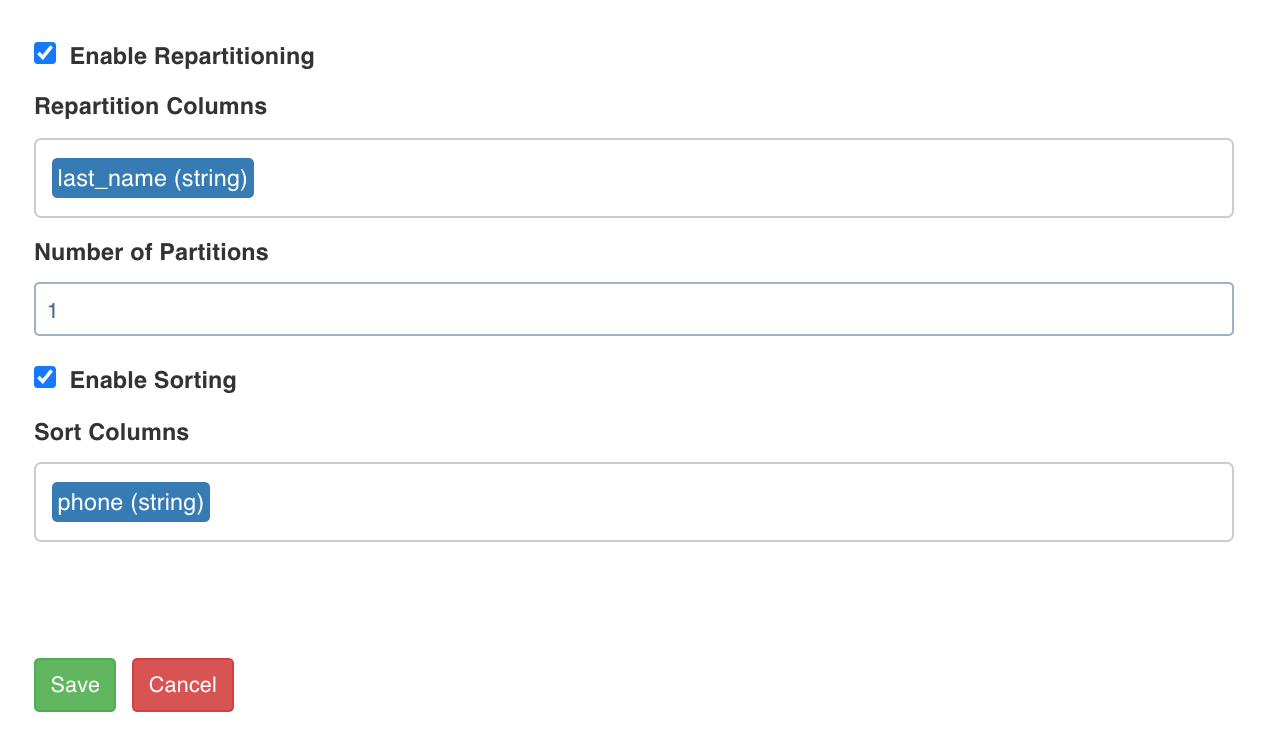
NOTE Columns selected for repartition cannot be used for sorting.
Preview Query
This tab displays the representational SQL queries for the transformations performed. The actual queries are optimized for the execution engine.
Preview SQL
This tab displays the set of SQLs to be executed in order to create and insert data into the target. The Preview SQL feature is available only in CDW environments for target nodes in 5.2 Pilot.
NOTE The Preview SQL tab can also be accessed from the top of the pipeline editor.
Audits
This tab displays the list of all actions performed on the specific node of the pipeline.