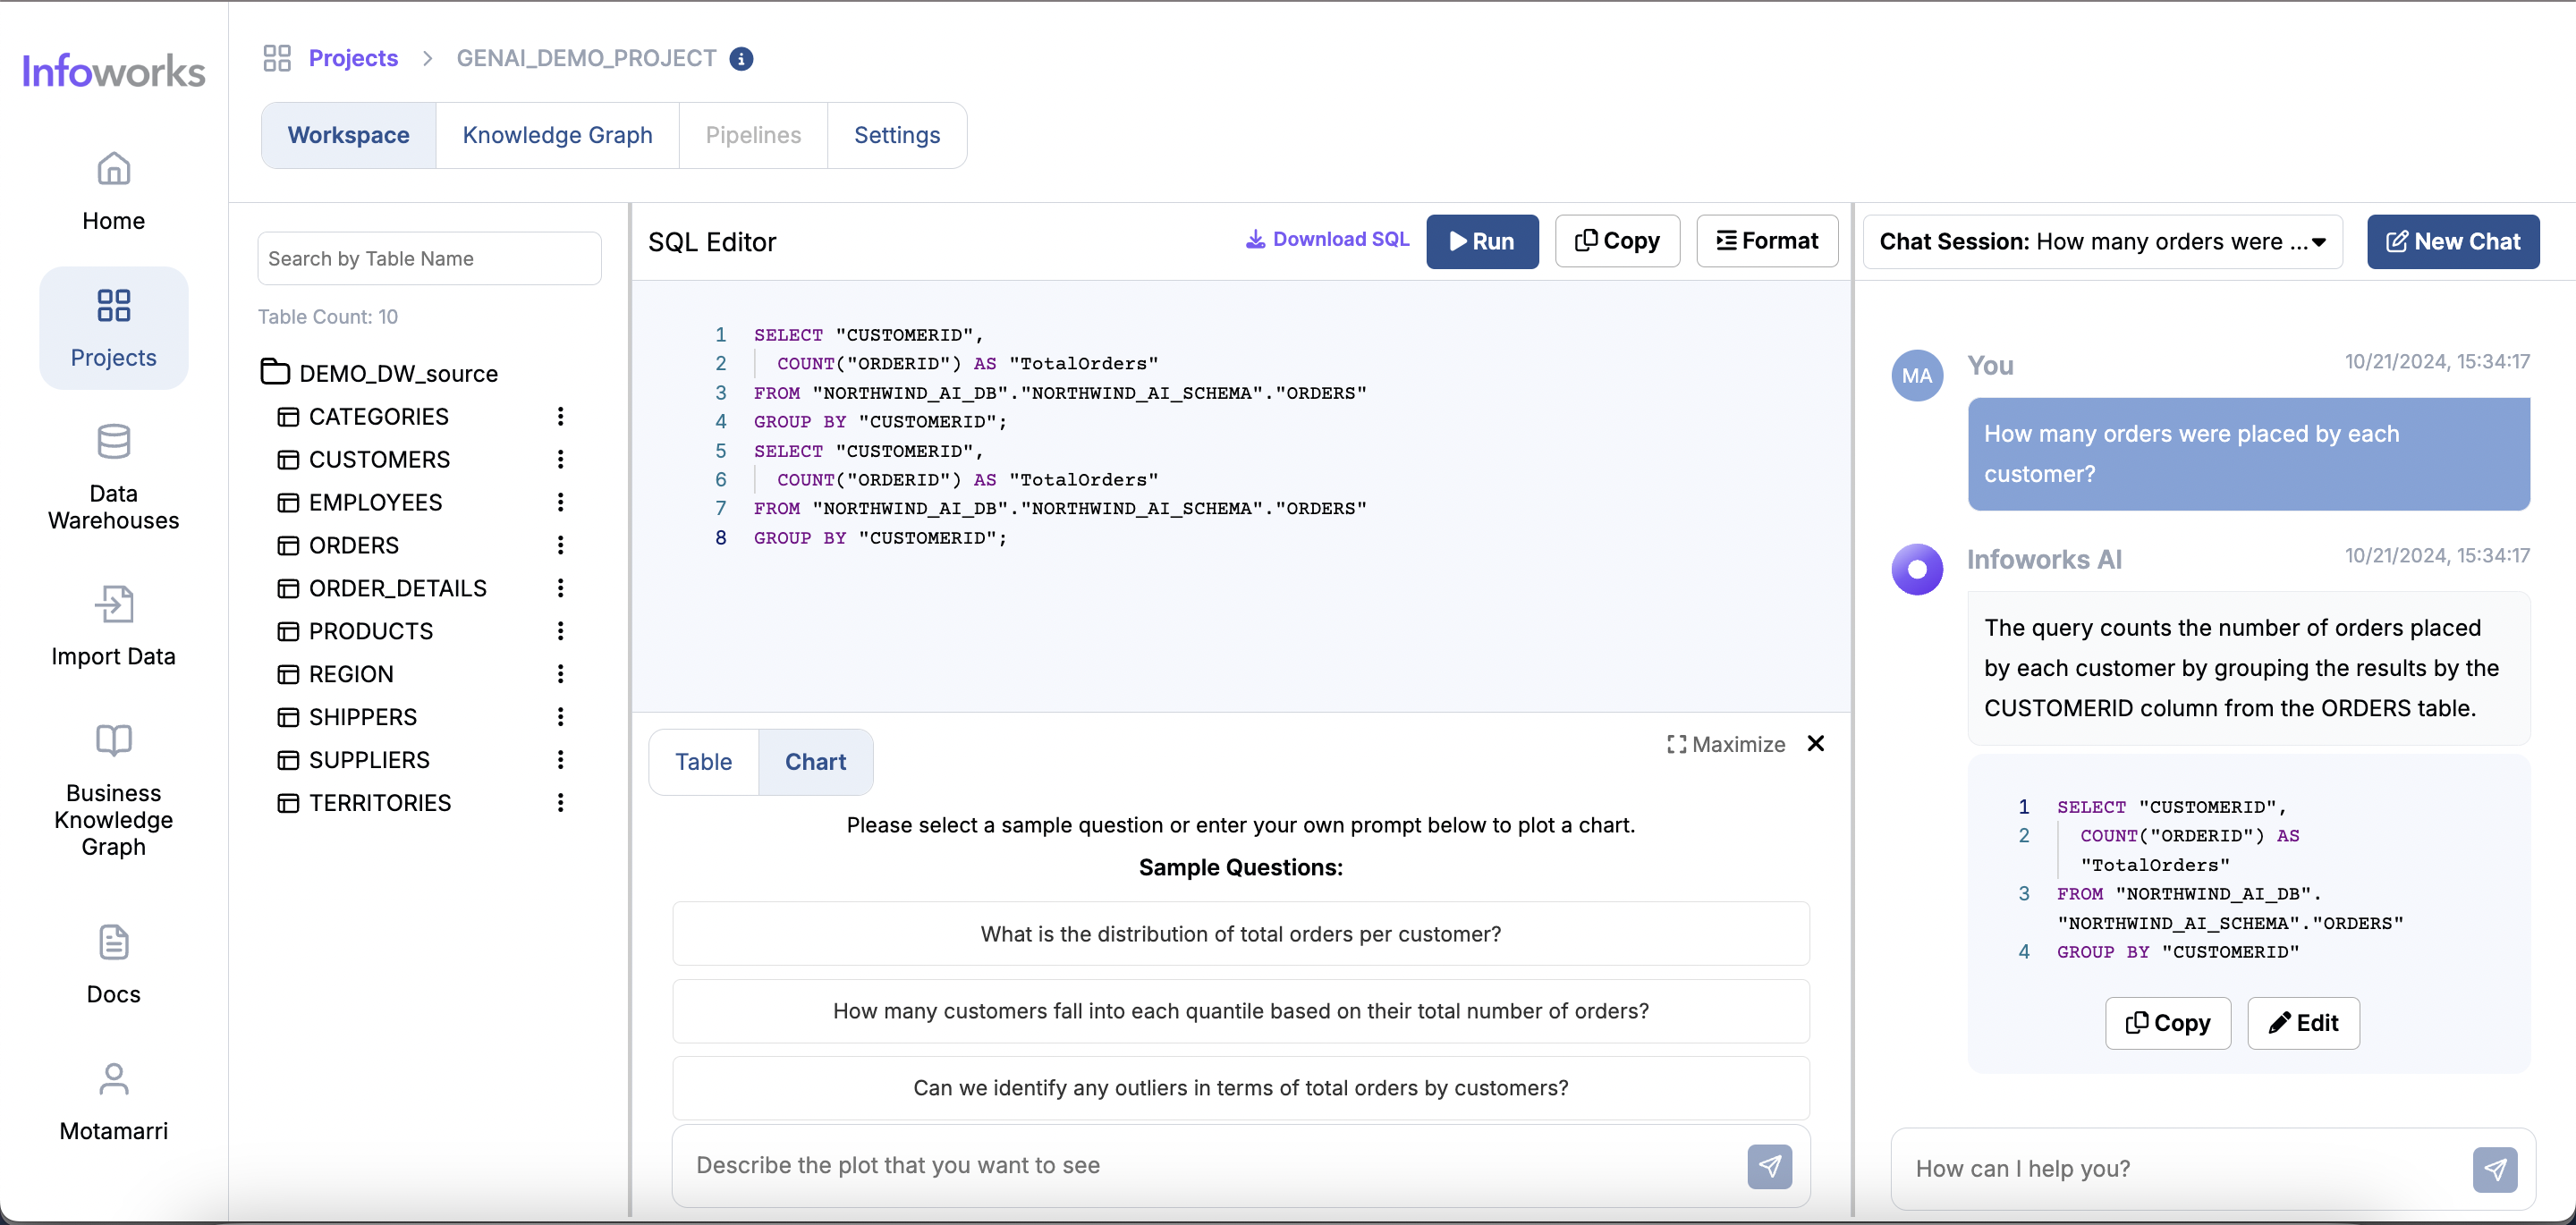
The Chart View in Infoworks AI allows users to visualize data based on the SQL query results. Users can either select from a list of suggested questions or input their own custom queries to generate insightful visualizations. These charts help users quickly analyze trends, distributions, and other data patterns, making complex datasets easier to understand.
How to use Chart View
Suggested Questions
Upon entering the Chart section, users are presented with a set of suggested questions.
These questions are designed to provide quick access to common insights of the resultant data.
Users can click on any suggested question to automatically generate the corresponding chart.
Custom Question Input
If users wish to visualize something specific, they can enter a custom query in the input box provided below the chart section.
After submitting a question, Infoworks AI will process the input and generate a chart based on the query.
Chart Generation
Once a question is submitted (either from the suggested list or custom input), Infoworks AI processes the underlying data and creates a visualization.
The generated chart is displayed, showing the visual representation of the data.
Types of Visualizations
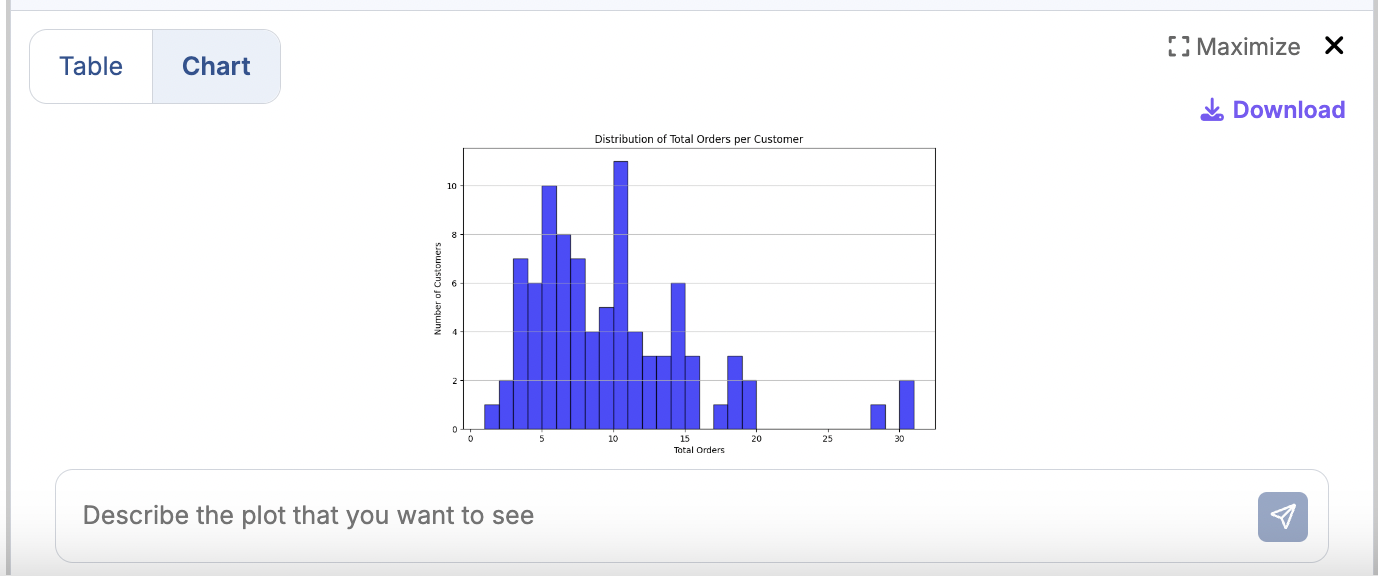
Currently, the system supports different types of charts such as histograms, bar charts, and pie charts, depending on the query.
In the example above, a histogram visualizes the distribution of total orders per customer, showcasing how frequently each order count occurs across customers.
Download Feature
Users have the option to Download the generated chart by clicking on the download button available next to the chart.
This allows users to save the visualizations locally for presentations, reports, or further analysis.
Features
Suggested questions for quick insights.
Custom input box for personalized visualizations.
Dynamic chart generation based on user queries.
Download charts for further analysis or sharing.