Navigation Menu
Projects in Infoworks AI consist of three main tabs: Workspace, Knowledge Graph, and Settings. The Workspace is designed to facilitate an efficient workflow and includes a schema browser on the left panel, a SQL Editor in the center, and an interactive chat panel along with chat history on the right.
Schema Browser (Left Panel)
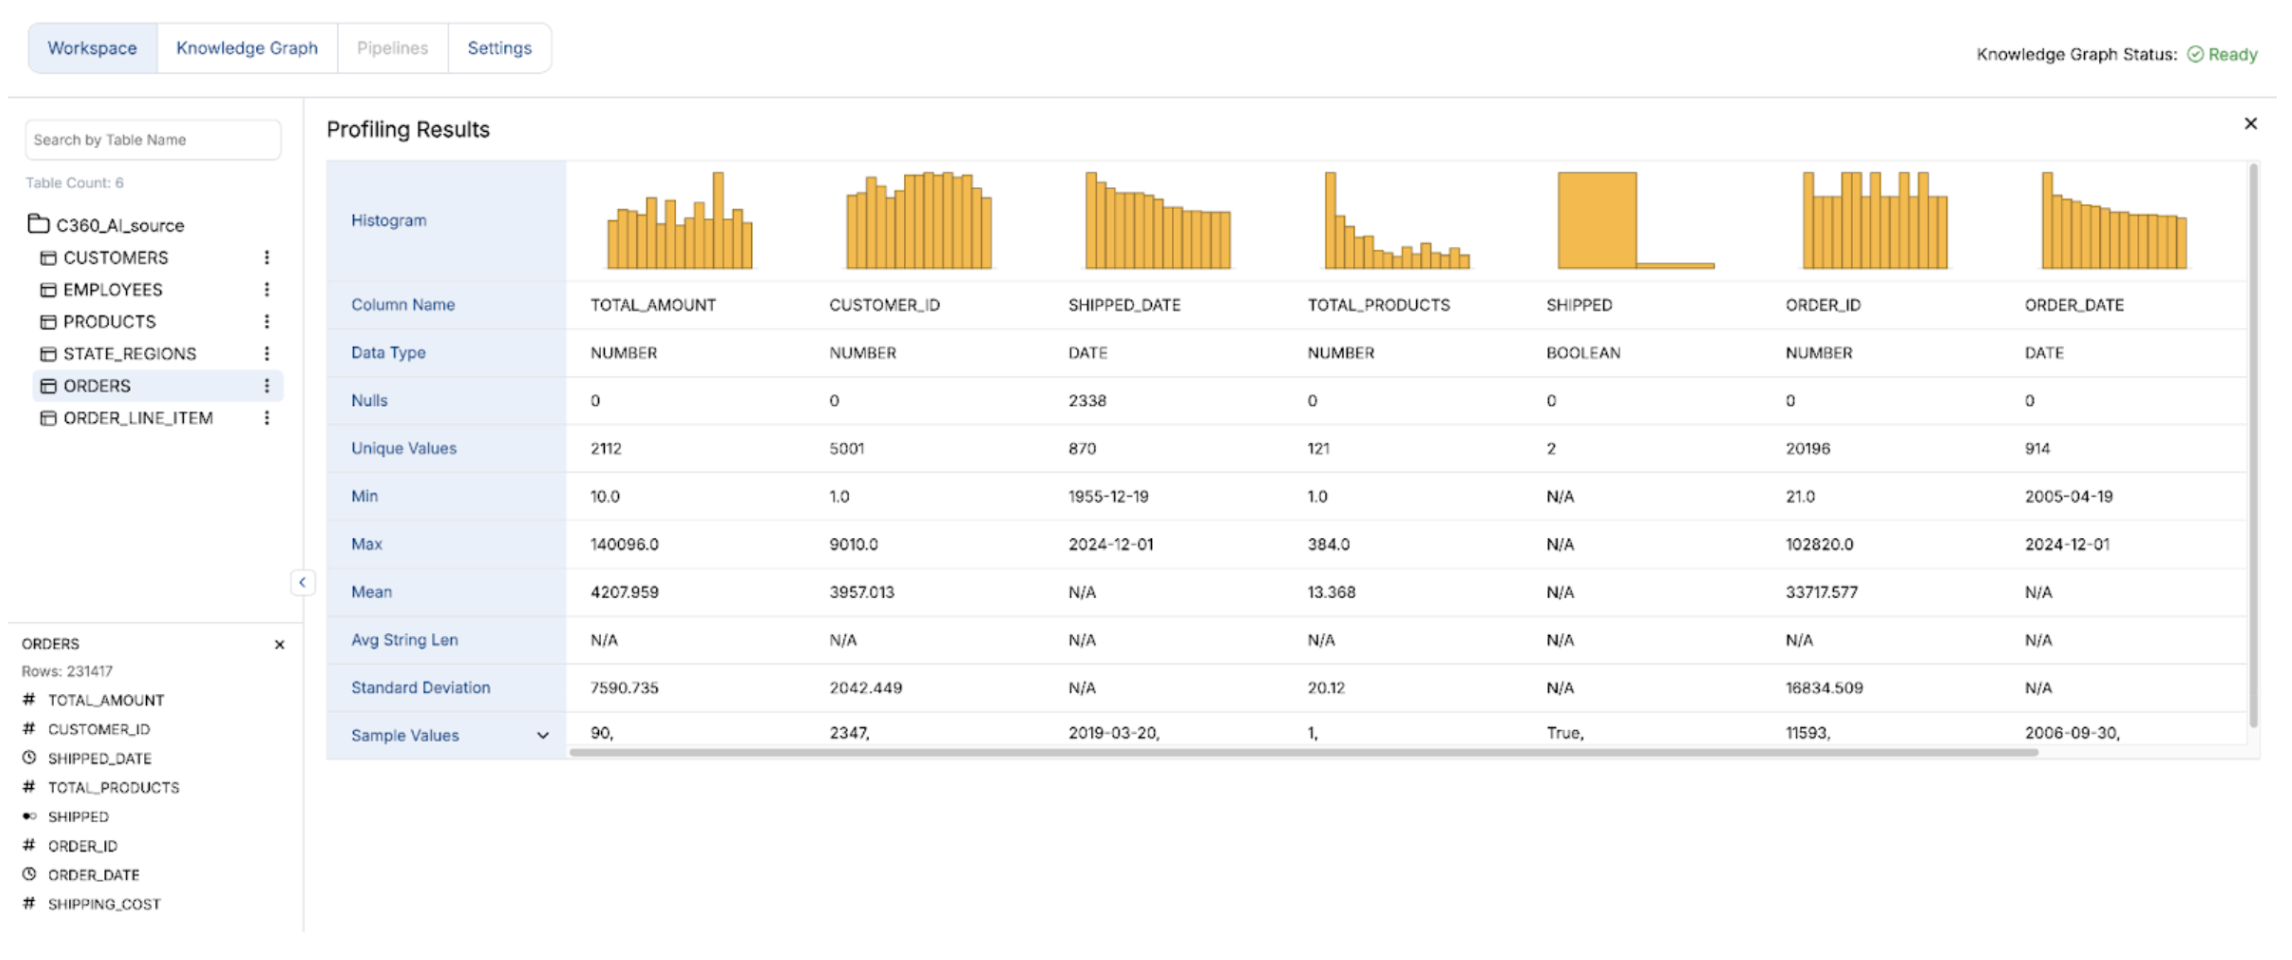
- Schema Browser: The schema browser allows users to navigate through the database schema, which is essential for understanding the structure and hierarchy of tables and fields available for query generation. This information can be used to formulate or refine queries with specific fields.
- Table Information: By clicking on a table within the schema browser, users can view its row count and a list of columns. If "Automatically Profile the Data" was enabled during data warehouse configuration, each table will feature a menu for accessing data profile information. To view this information, click the three-dot icon next to the table name and select "Show Profile."
- Profiling Results: The profiling results display statistics, including counts of null and unique values, standard deviation, and sample values.

Interactive Chat with history dropdown to review past interactions (Right Panel)
- New Chat: A button to initiate a new conversation with the AI, allowing users to start fresh queries.
- Natural Language Queries: Users can type questions or statements in natural language to describe the data they need, such as, "What is the employee distribution across different territories?" If a query is ambiguous or if Infoworks AI requires more information, it may prompt the user for clarification and additional inputs.
- SQL Generation: Below the user's question, Infoworks AI generates a response that includes the generated SQL query, which is syntactically highlighted for improved readability.
- Query Explanation: Accompanying the SQL query is an explanation of its function, helping users understand how their request was translated into SQL.
- Chat History: Displays a timestamped history of user interactions with the AI, providing context and reference for previous queries. Users can refer to the dropdown list on the right panel for a log of past interactions, assisting in tracking the evolution of queries or revisiting previous SQL statements.
- Timestamps: Each interaction is timestamped, allowing users to identify when each prompt was made.
- Custom Names: Users can edit the names of previous chat sessions for easy reference and searching.
SQL Editor (Center Panel)
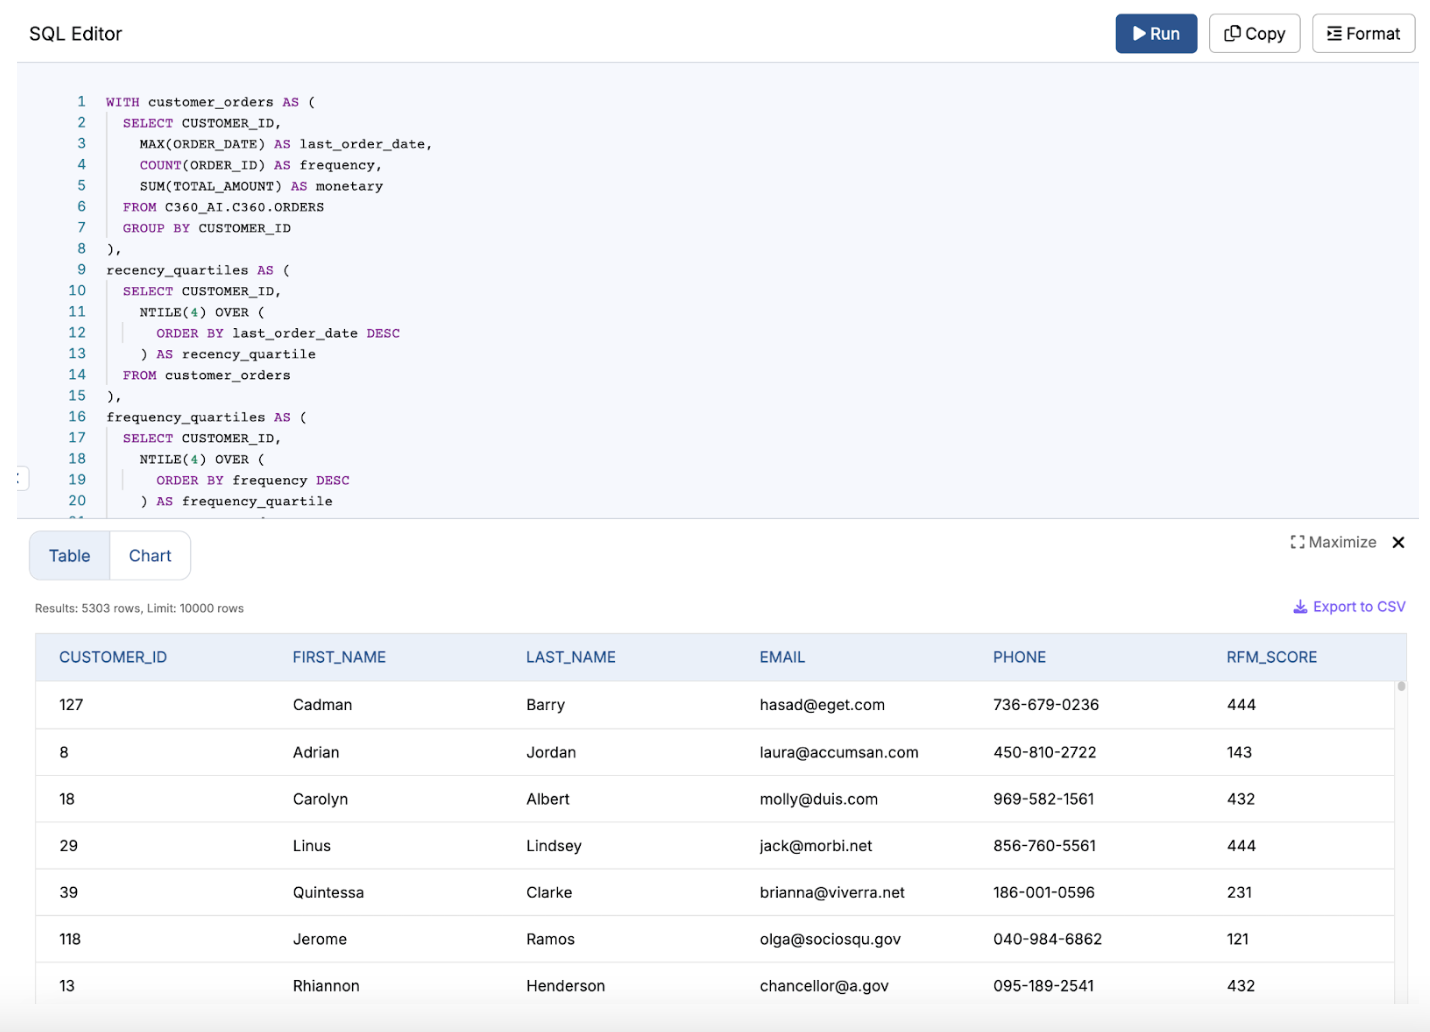
The SQL Editor offers features such as syntax highlighting, formatting, and quick access to executing queries generated by Infoworks AI. These functionalities enhance the efficiency of data analysis by allowing users to easily review query results.
When the AI generates SQL in the right-side chat panel, clicking "Edit" allows users to view the SQL code in full-screen mode within the SQL Editor. In this interface, users can review the code, make any necessary edits, and click "Run" to execute the query against the data warehouse and view the results.
- SQL Query Box: Users can copy, review, write, and edit SQL queries within this area. They can easily copy the generated SQL from the chat interface in the right panel to get started.
- Run Button: This button executes the selected query within the SQL Editor. The editor supports maintaining and editing multiple queries; users simply select the desired query and click "Run" to execute it.
- Copy and Format Buttons: These buttons enable quick copying of the query or formatting it for improved readability. Users can select the query they wish to copy or format.
- Download SQL: This option allows users to download all content from the SQL Editor for offline use.
Running SQL (Bottom Panel)
Clicking "Run" in the SQL Editor executes the query against the data warehouse and displays the results in the bottom half of the SQL Editor. From this section, users can:
- Review Data for Accuracy: Inspect the query results to ensure they meet expectations, with a button available to maximize the view for a more comprehensive analysis.
- Export Results to CSV: Use the option to export the results in CSV format for external analysis or reporting.
- Operationalize Results: Return to the chat panel and request the AI to generate and save a view of the query in the warehouse, subject to authorization.
- Visualize Data: Switch to the Chart tab to create a visual representation of the data, enhancing understanding and presentation.
