After creating the pipeline group, adding pipelines to the group, and setting their execution order, the pipeline group is ready to be built.
Following are the steps to build a pipeline group:
Step 1: Go to Domains and click the respective domain name.
Step 2: Under the Pipeline Groups tab, click the Edit button for the respective pipeline group.
Step 3: Go to Jobs tab and click Build Pipeline Group.
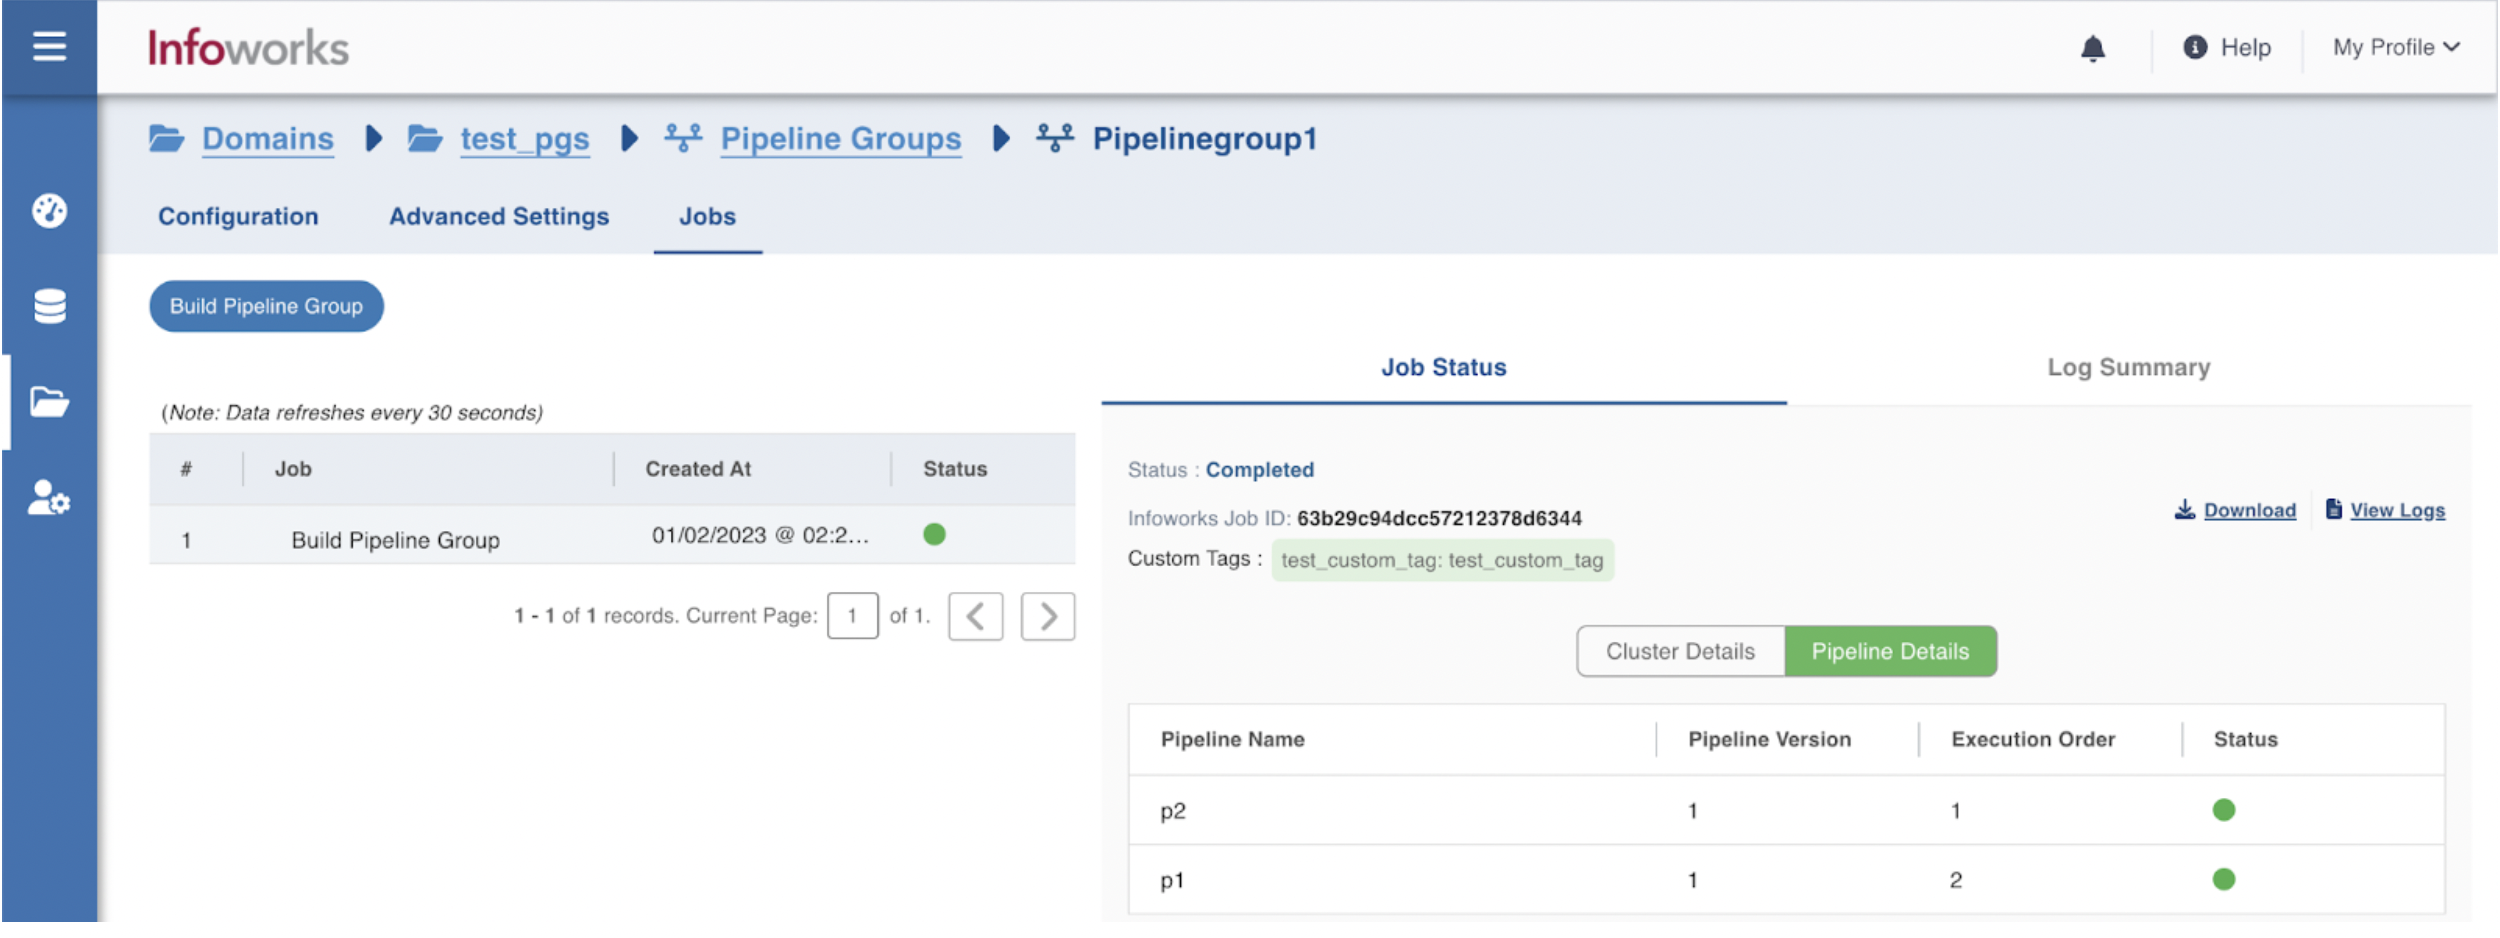
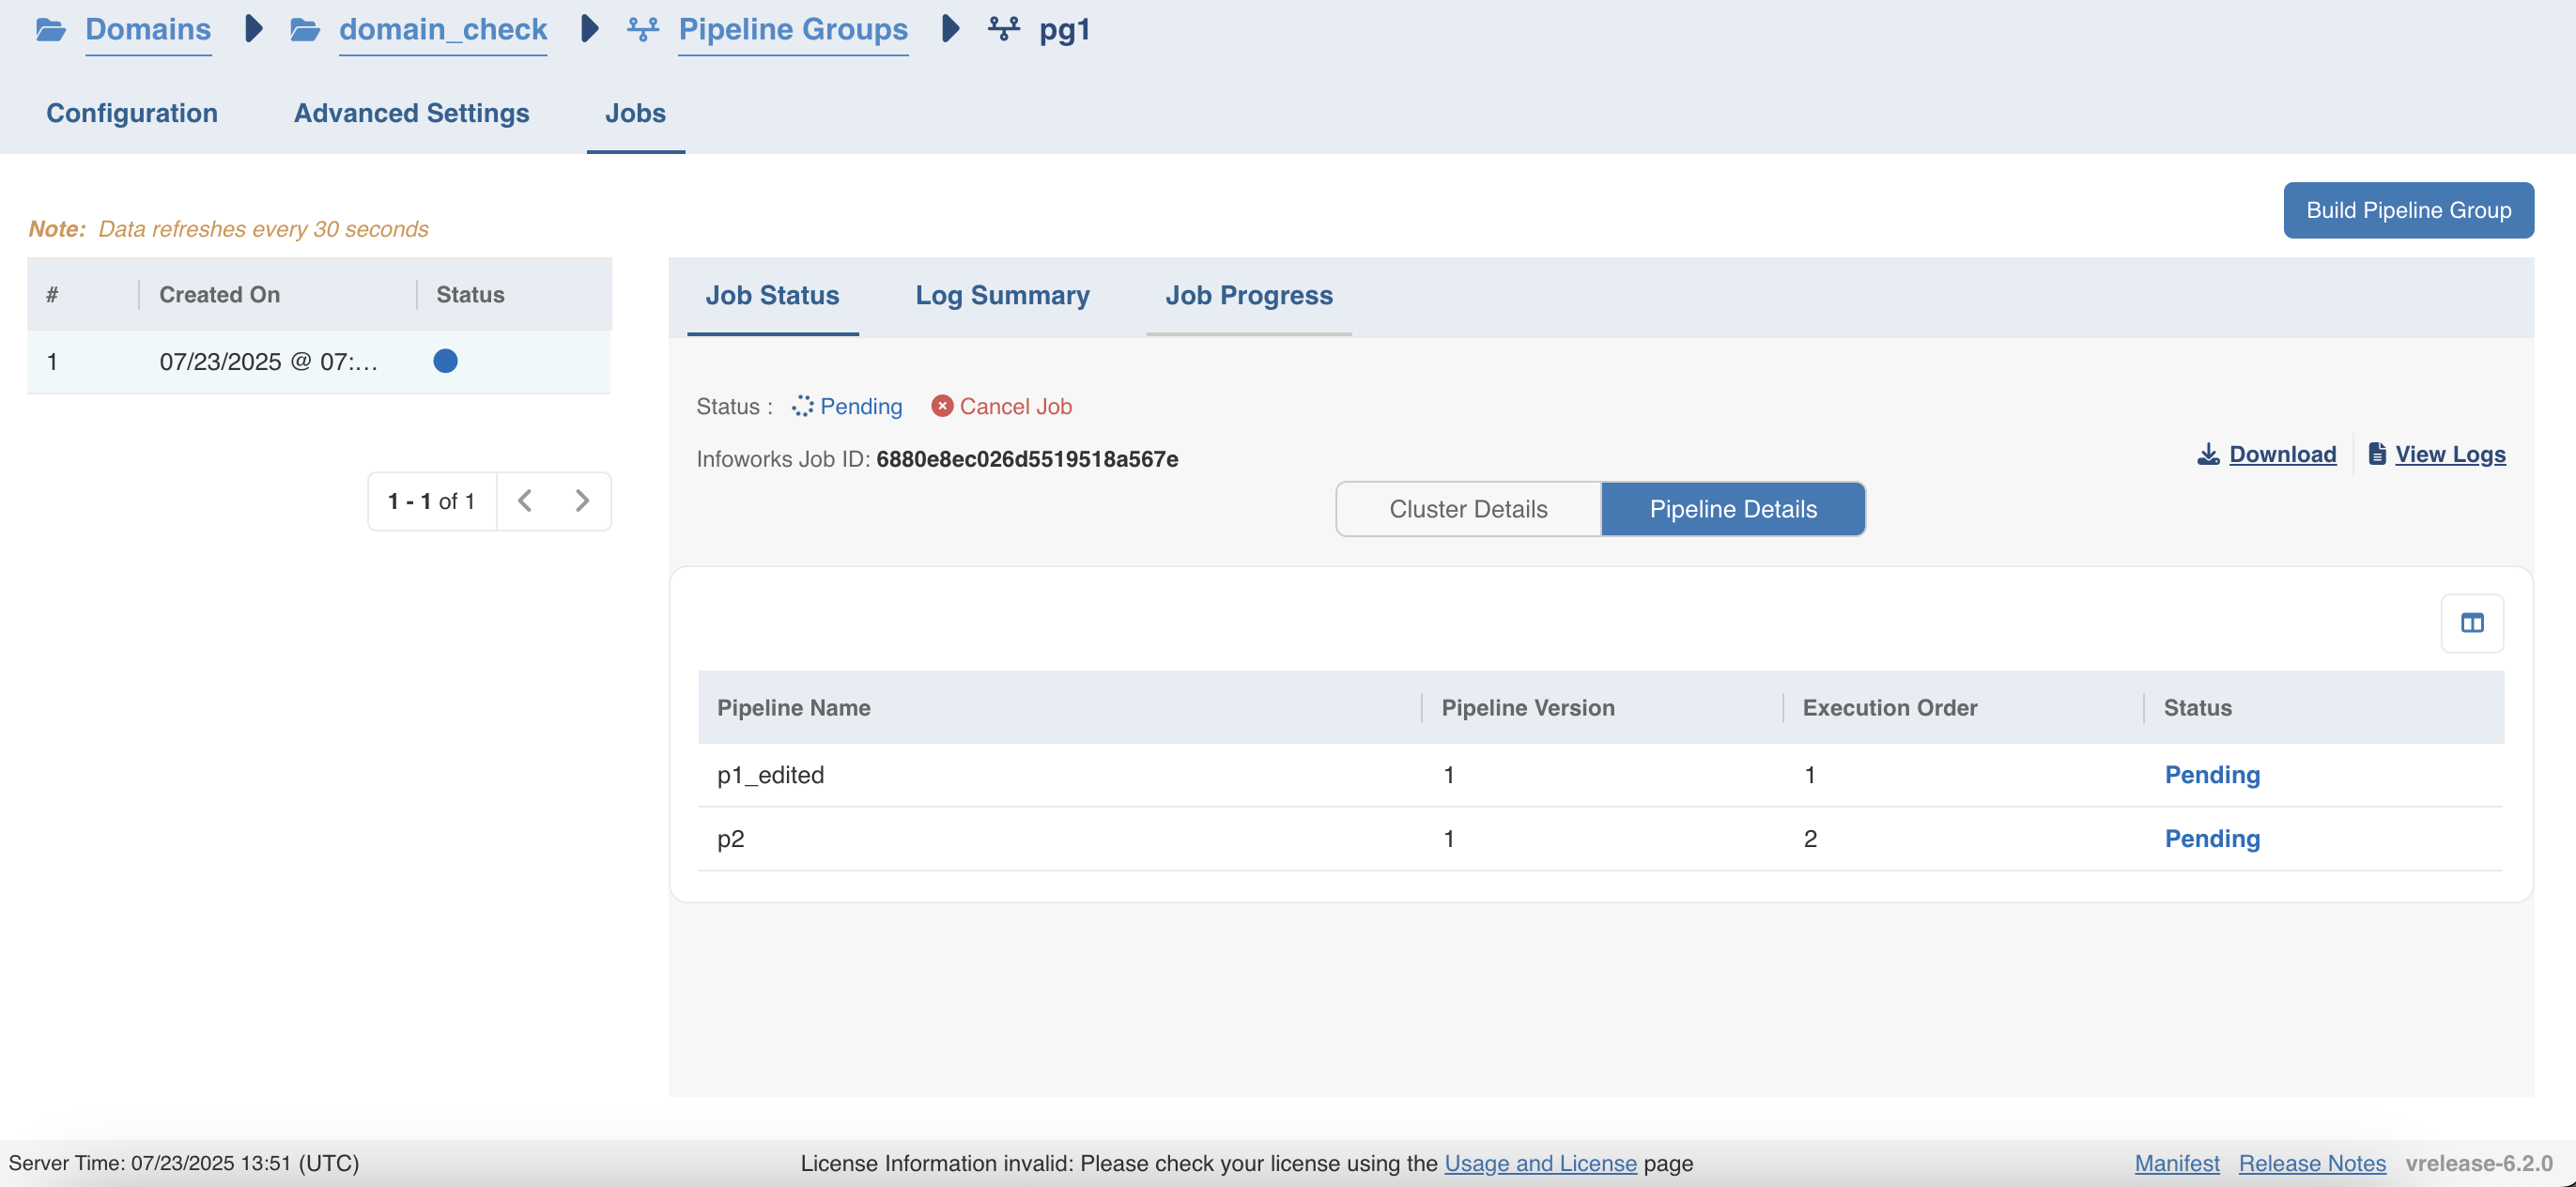
Job Status Tab
The Job Status tab provides a high-level overview of the selected Pipeline Group Job's execution state within a pipeline group. It includes basic metadata and control options, such as the ability to cancel a pending or running job.
Key Elements
| Field | Description |
|---|---|
| Status | Displays the current status of the job. Possible values include Pending, Running, Success, or Failed. |
| Cancel Job | Available for jobs that are still pending or in progress. Clicking this button terminates the job execution. |
| Infoworks Job ID | A unique identifier for the job. This can be used for debugging or log tracking. |
Sub Tabs
- Cluster Details:
This section contains information related to the cluster on which the job is scheduled or currently running.
- Pipeline Details:
This tab provides a pipeline-level view of the current job execution. It lists all pipelines that are part of the pipeline group associated with the job, along with their execution metadata. Table Columns:
| Field | Description |
|---|---|
| Pipeline Name | The name of the individual pipeline (e.g., p1_edited, p2) |
| Pipeline Version | Indicates the version of the pipeline being executed |
| Execution Order | Specifies the order in which the pipelines are executed within the group. Lower numbers execute first |
| Status | Displays the execution status of each pipeline (Pending, Running, Success, or Failed) |
This section helps users understand the flow of execution and track the individual progress of pipelines within the group.
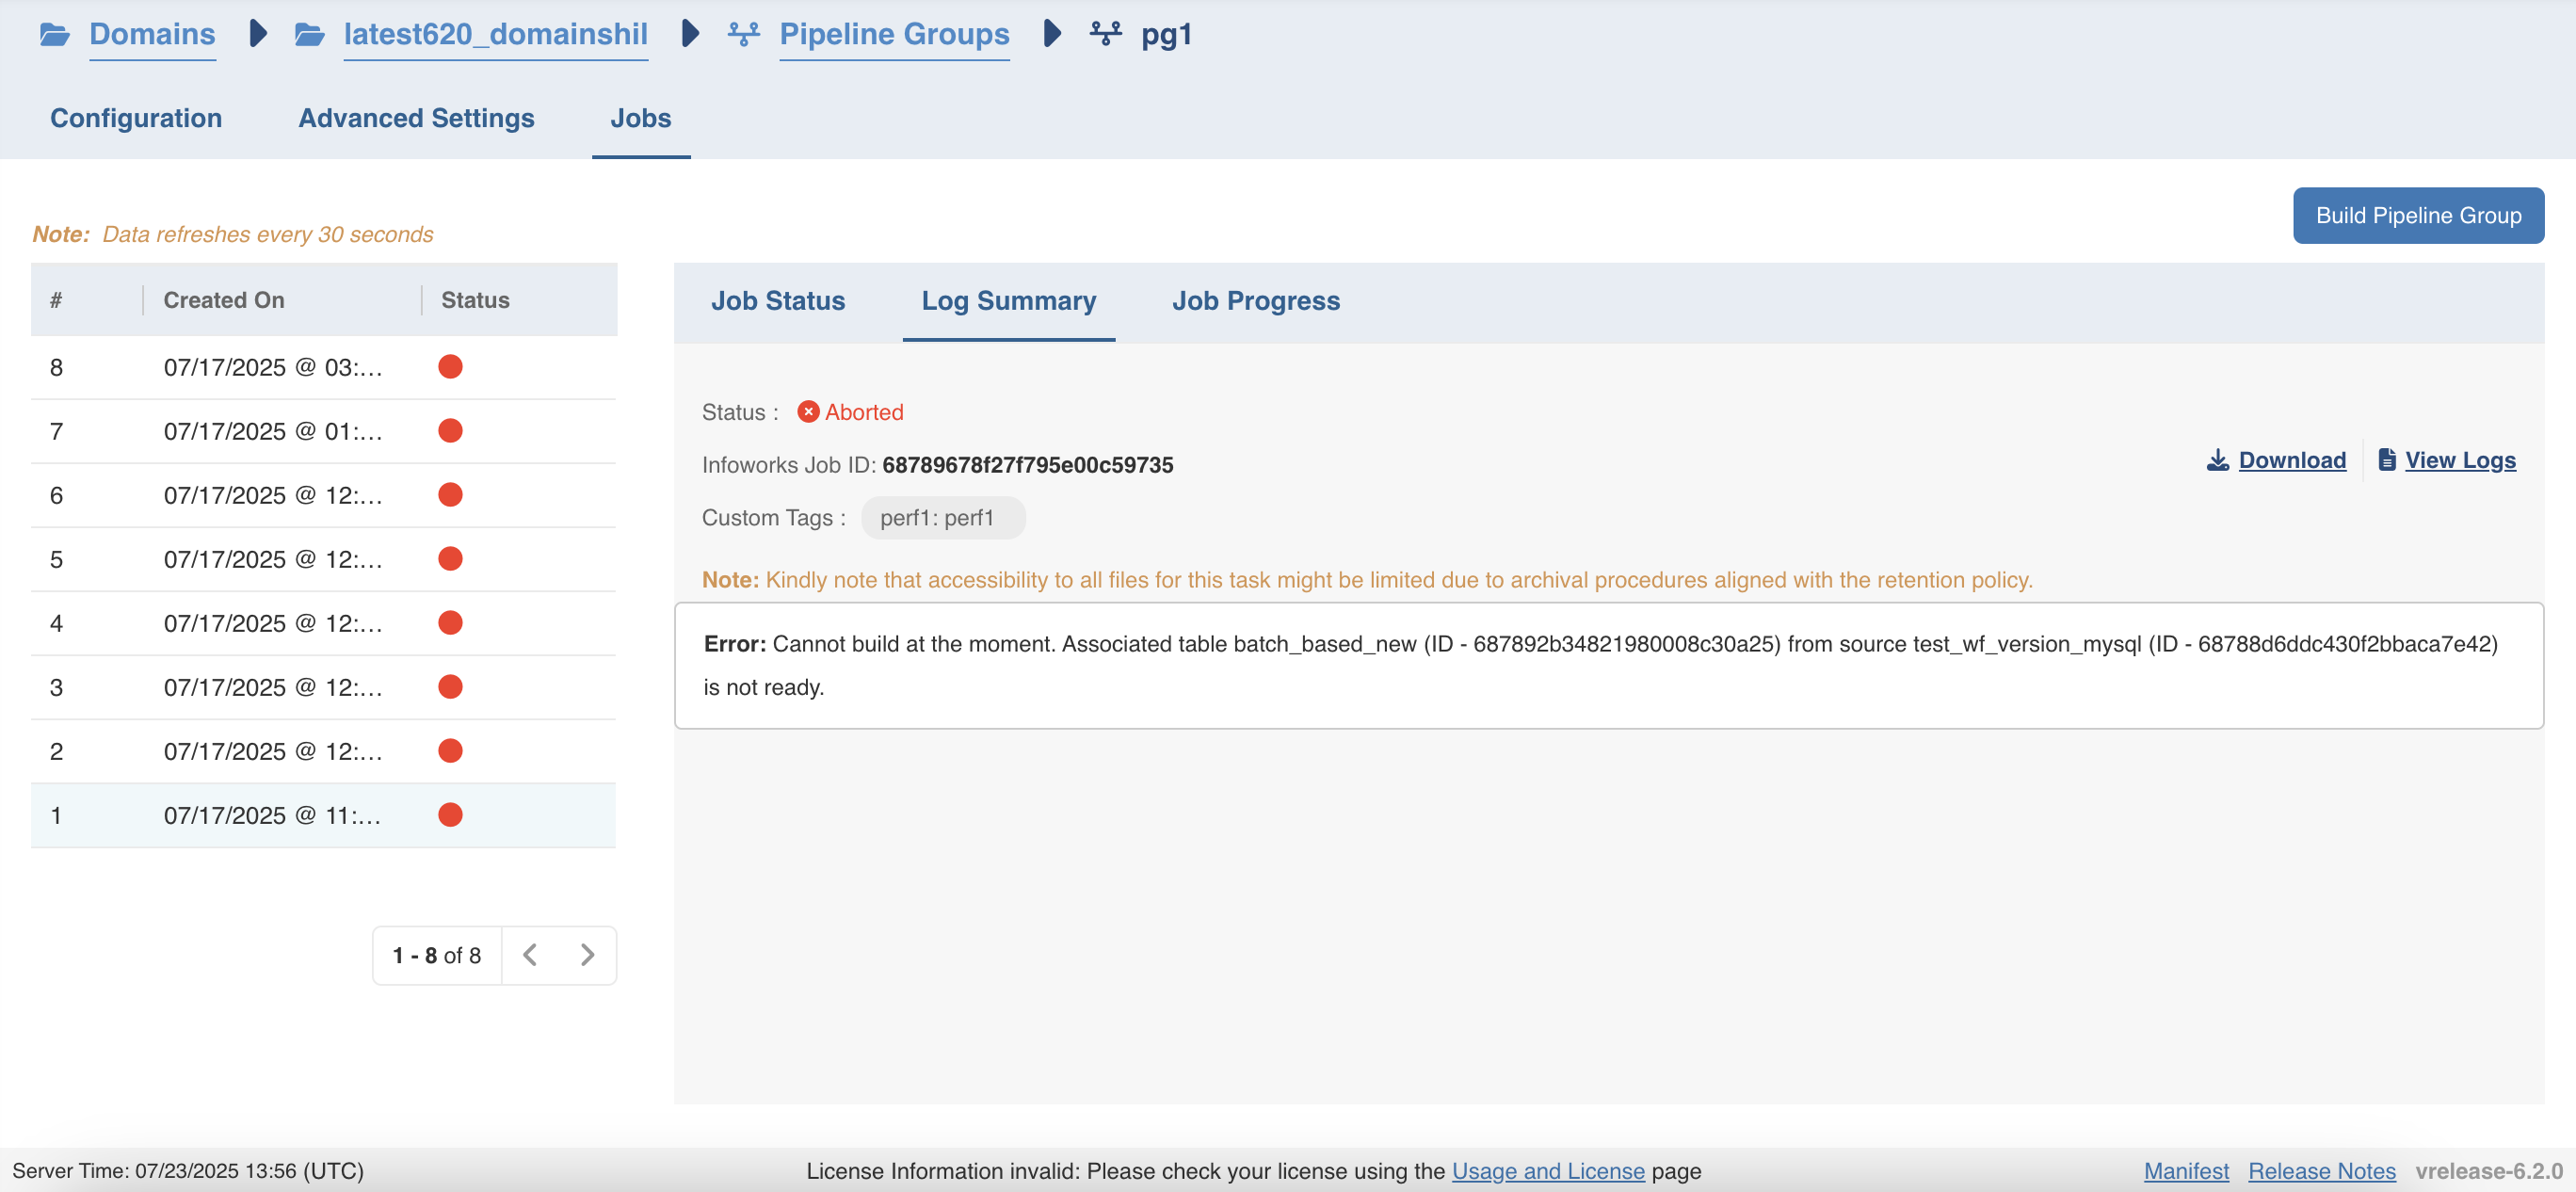
Log Summary Tab
The Log Summary tab provides detailed logs generated during the execution of a selected job within a pipeline group. These logs are critical for debugging and understanding job behavior, especially in the case of failures or aborted executions.
Key Elements
| Field | Description |
|---|---|
| Status | Reflects the final state of the job (e.g., Aborted, Success, Failed, Pending, Running). |
| Infoworks Job ID | Unique identifier of the job to correlate logs and internal tracking. |
| Custom Tags (if any) | Shows any tags associated with the job, which may include performance or custom metadata. |
Log Content
The core section of this tab displays the relevant logs for the selected job. These logs may include:
| Field | Description |
|---|---|
| Error Messages | Explicit error details, often pointing to failed dependencies or misconfigurations (e.g., missing or unready source tables). |
| Warnings | Information that may not block execution but is noteworthy for system behavior or data flow. |
| Execution Logs | Logs that track events throughout the job's lifecycle — such as table readiness checks, resource provisioning, task start/stop events, etc. |
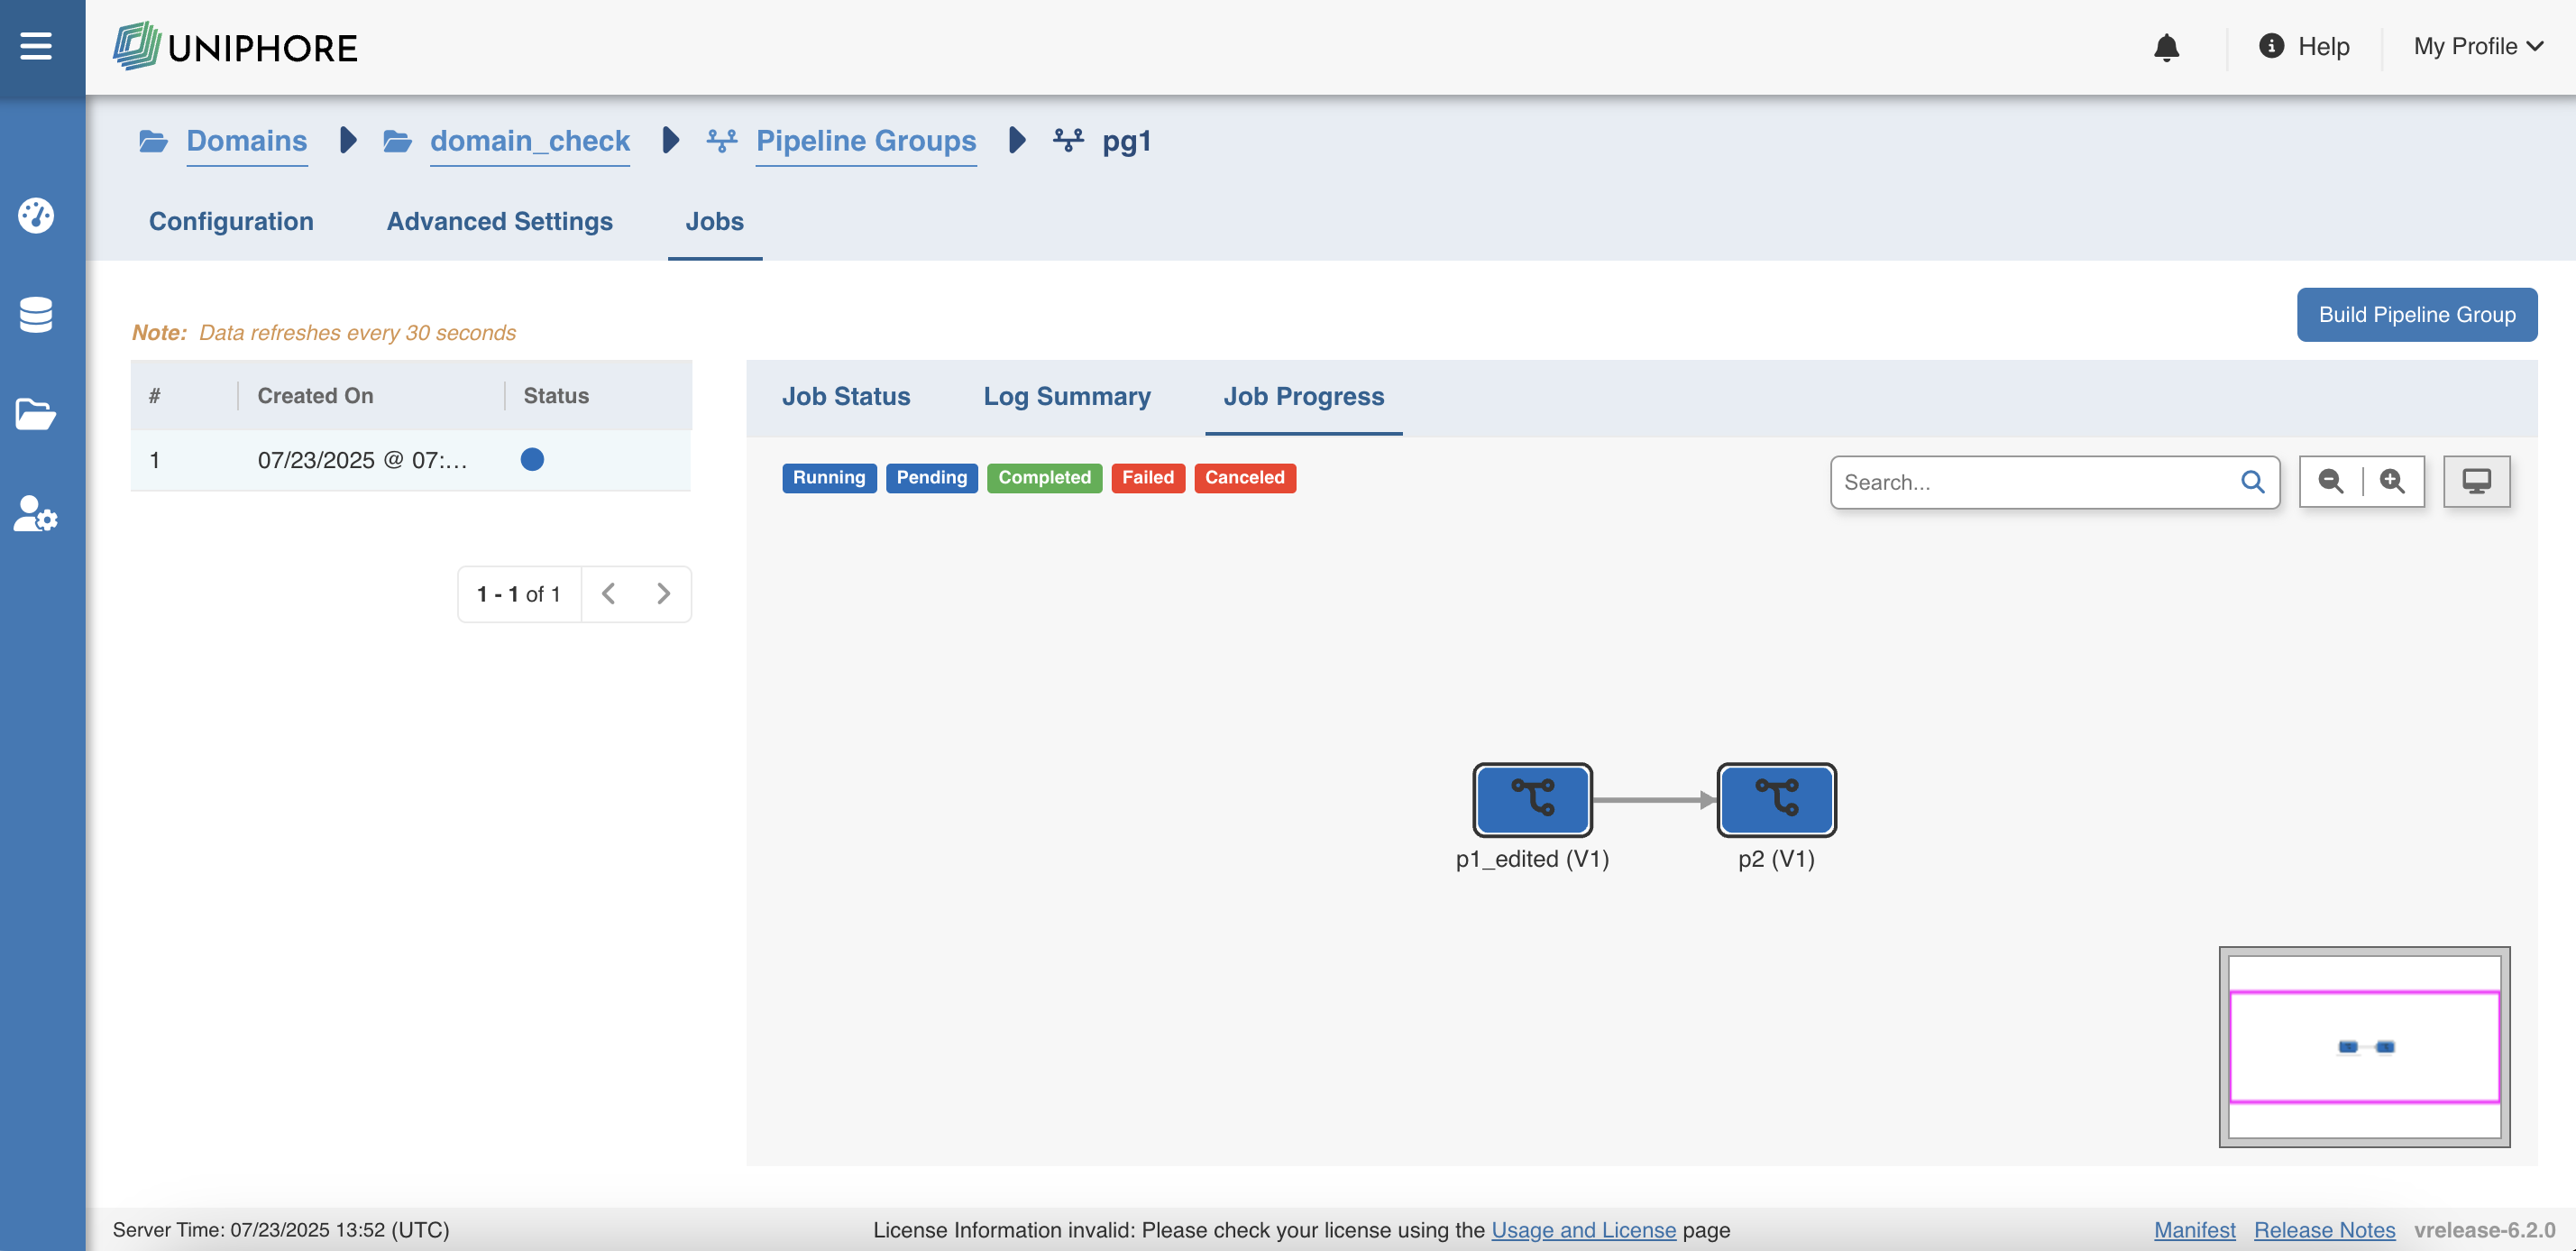
Job Progress Tab
The Job Progress tab provides a visual representation of the execution flow of a pipeline group job. It helps users quickly understand the order of execution, status of each pipeline, and their interdependencies through a node-based graphical layout.
Key Features
- Pipeline Nodes: Each node in the graph represents an individual pipeline in the pipeline group (e.g.,
p1_edited,p2). The version of each pipeline (e.g.,V1) is also displayed within the node. Arrows between nodes depict the execution order and dependencies. - Execution Order: Pipelines are arranged left to right (or top-down in some cases) to visually represent the execution flow. The arrows between nodes clearly indicate the order and directional flow of execution.
UI Elements
| Field | Description |
|---|---|
| Legend | Colored labels such as Running, Pending, Completed, Failed, and Canceled help users identify the current status of each node/pipeline at a glance. These correspond to the color of the nodes in the visual graph. |
| Search Bar | A search box is provided to help users quickly locate a specific pipeline node by name. |
| Zoom Controls |
|
| Preview Pane (Mini-map) | Located at the bottom-right, this mini-map provides a bird’s-eye view of the entire job graph. It helps users easily navigate large pipeline groups by dragging the viewport frame. |
The Job Progress tab is especially useful for monitoring large, multi-step pipeline groups in real time and identifying bottlenecks or failures through its intuitive visual layout.