The Pivot node is used to convert data from rows to columns.
Following is a sample table to be pivoted:
| orders.order_id | orders.cust_id | orders.prod_id |
|---|---|---|
| 50001 | SMITH | 10 |
| 50002 | SMITH | 20 |
| 50003 | ANDERSON | 30 |
| 50004 | ANDERSON | 40 |
| 50005 | JONES | 10 |
| 50006 | JONES | 20 |
| 50007 | SMITH | 20 |
| 50008 | SMITH | 10 |
| 50009 | SMITH | 20 |
The count for orders grouped by cust_id pivoted on prod_id is as follows:
| cust_id | prod__10 | prod__20 | prod__30 | prod__40 |
|---|---|---|---|---|
| JONES | 1 | 1 | NULL | NULL |
| ANDERSON | NULL | NULL | 1 | 1 |
| SMITH | 2 | 3 | NULL | NULL |
Following are the steps to apply Pivot node in pipeline:
Connect the source node to the Pivot node.
Double-click the Pivot node. The properties page is displayed.
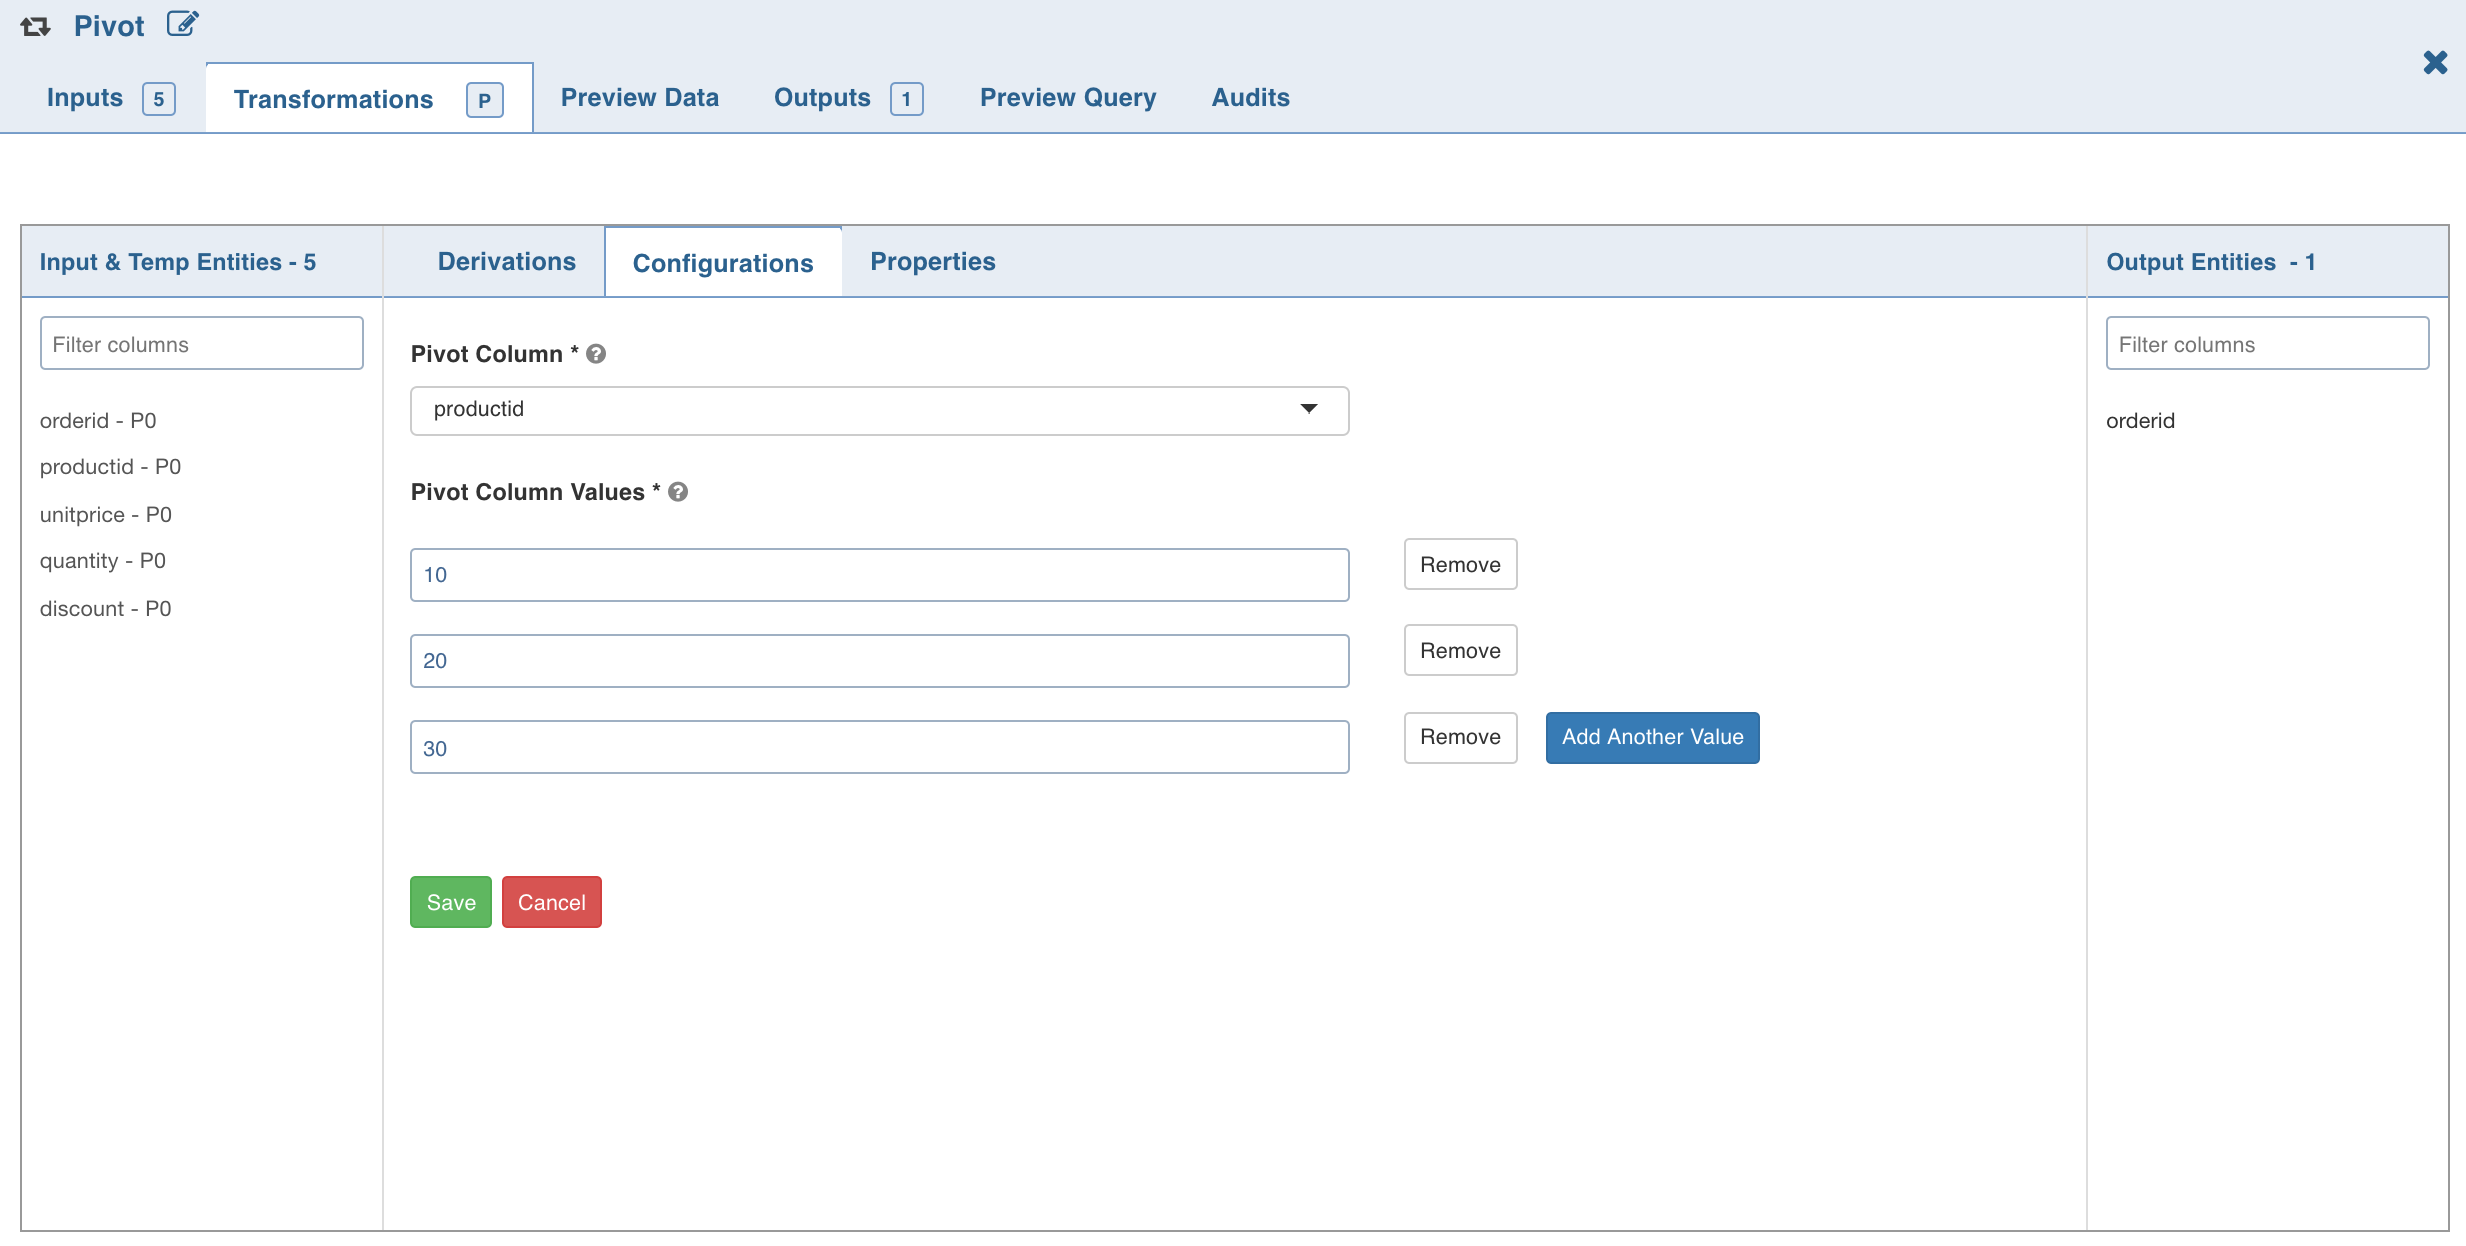
Click the Configurations tab and click Edit Configurations.
Select the column to be pivoted, enter the pivot values and click Save.
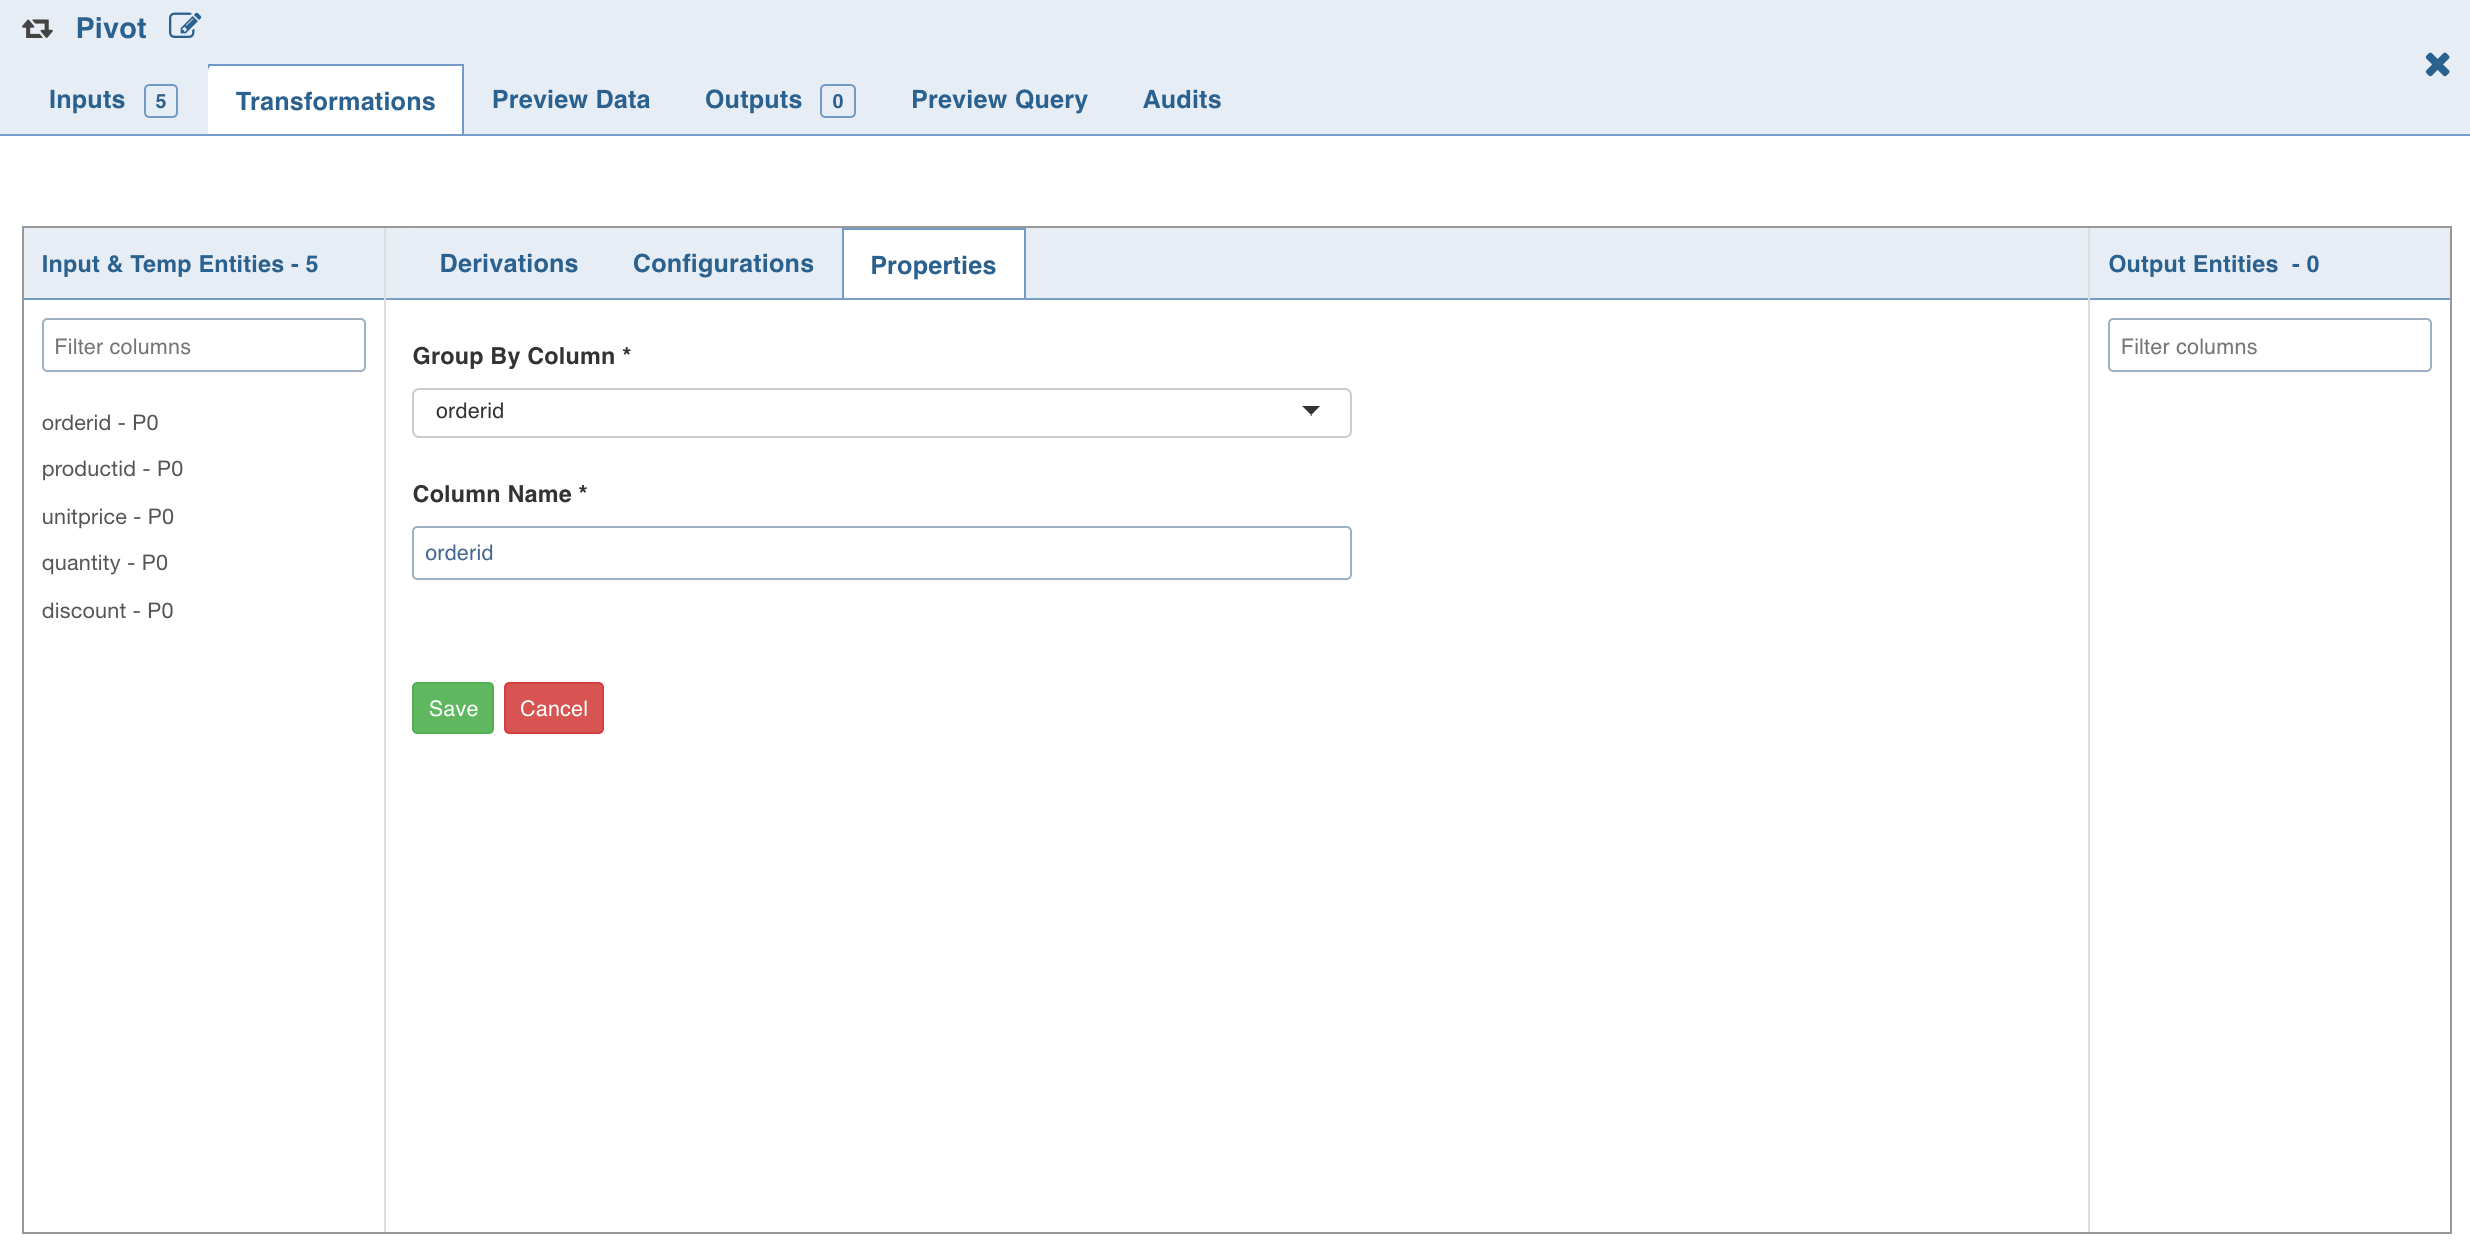
5. Click the Properties tab and click Add Group By.
- Select the group by columns, enter the column name and click Save.
7. Click Add Aggregate, select the aggregate operation, aggregate column and click Save. The columns are added
automatically based on the pivot values; these names can be overridden.
- Click the Preview Data tab to view the updated data.