The dashboard displays the summary of key actions performed by the user on enterprise data. This provides a statistical framework to view and analyse data for better business performance. It also provides details on the engagement of users from different roles, with Infoworks DataFoundry.
Click Dashboard menu to view the Infoworks DataFoundry Engagement Dashboard.
If the dashboard is not displayed, perform the following steps:
NOTE: This occurs when the web browser is unable to resolve FQDN of the edge node.
Set
proxy_server_hostkey to public IP of the Infoworks DataFoundry edge node in the conf.properties file.Open 3030 port.
Restart the user interface and nginx by running the following commands:
./stop.sh UI && ./stop.sh nginxand./start.sh UI && ./start.sh nginxNow, click Dashboard menu to view the Infoworks DataFoundry Engagement Dashboard.
The Infoworks DataFoundry Engagement Dashboard consists of two tabs:
The tabs are enabled with buttons on the top right corner to enable data filter based on the duration to be considered for data population.
Data Engagement Metrics
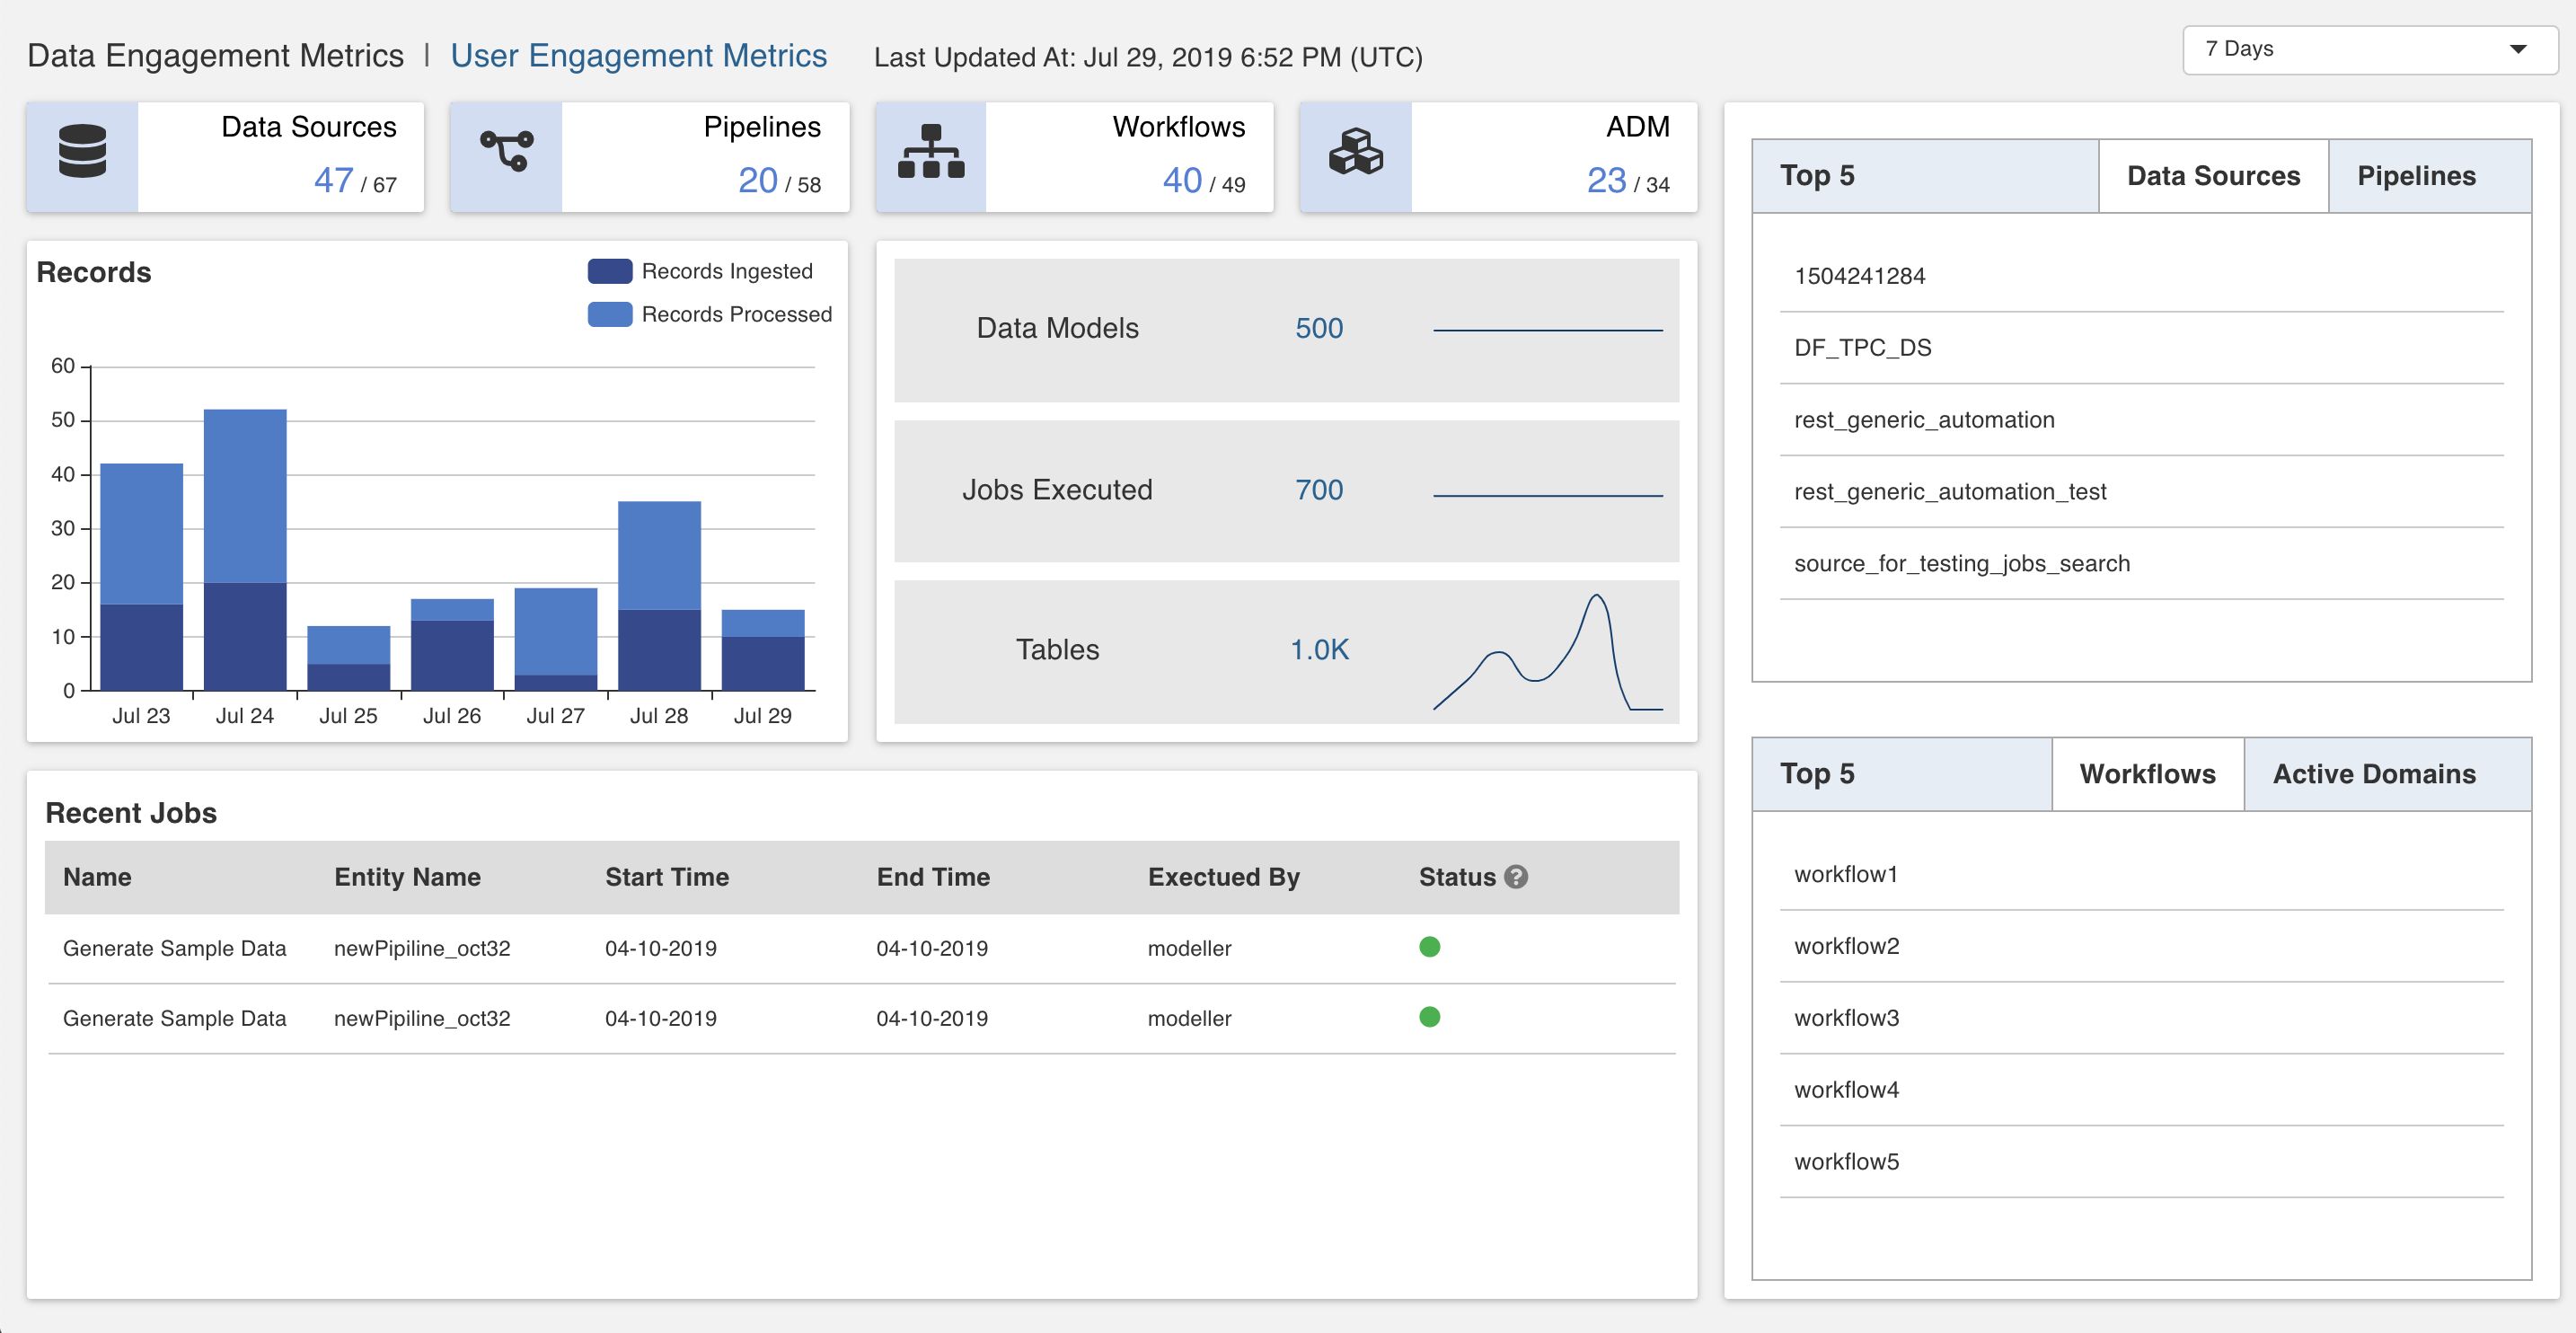
This provides a visual representation of data statistics to view and analyse data parameters such as data sources, pipelines, workflows, cubes, and their associated statuses.
The following table describes the Data Engagement Metrics items:
Item | Description |
|---|---|
Data Sources | Displays the number of data sources created by the user. For example, 47/67, where 47 is the number of data sources created in the selected duration, whereas 67 is the total number of data sources created since Infoworks DataFoundry has been launched. |
Pipelines | Displays the number of pipelines created by the user. For example, 20/58, where 20 is the number of pipelines created in the selected duration, whereas 58 is the total number of pipelines created since Infoworks DataFoundry has been launched. |
Workflows | Displays the number of workflows created by the user. For example, 40/49, where 40 is the number of workflows created in the selected duration, whereas 49 is the total number of workflows created since Infoworks DataFoundry has been launched. |
ADM (Accelerated Data Models) | Displays the number of external pipeline targets (snowflake export). For example, 23/34, where 23 is the number of ADMs created in the selected duration, whereas 34 is the total number of ADMs created since Infoworks DataFoundry has been launched. |
Records | Displays the records processed and records ingested. *Records Processed: Total number of ingested records which includes full load or ongoing CDC, records processed by each pipeline, and records processed by export jobs. *Records Ingested: Total number of the full load and CDC records ingested. |
Data Models | Displays the number of cubes and external pipeline targets (snowflake export). |
Jobs Executed | Displays the number of jobs run per day (machine activity) which includes data ingestion pipeline jobs, number of tables ingested, data transformation pipelines, data model builds, orchestrator workflows processed, and export jobs. |
Tables | Displays the number of data tables ingested. |
Recent Jobs | Displays details of the latest twenty jobs, irrespective of their completion status, and belonging to all the users. |
Top 5 | The following sections are available under the Top 5 tab: *** Data Sources**: Top five data sources based on the maximum number of pipelines or data exports driven. *** Pipelines**: Top five pipelines based on the number of times the pipelines are scheduled in a week to refresh data models. *** Workflows**: Top five workflows based on the number of schedules of the workflow in a week. *** Active Domains**: Top five active domains based on number of pipelines, models and workflows. |
$plugin[9kyuwdxemp]
User Engagement Metrics
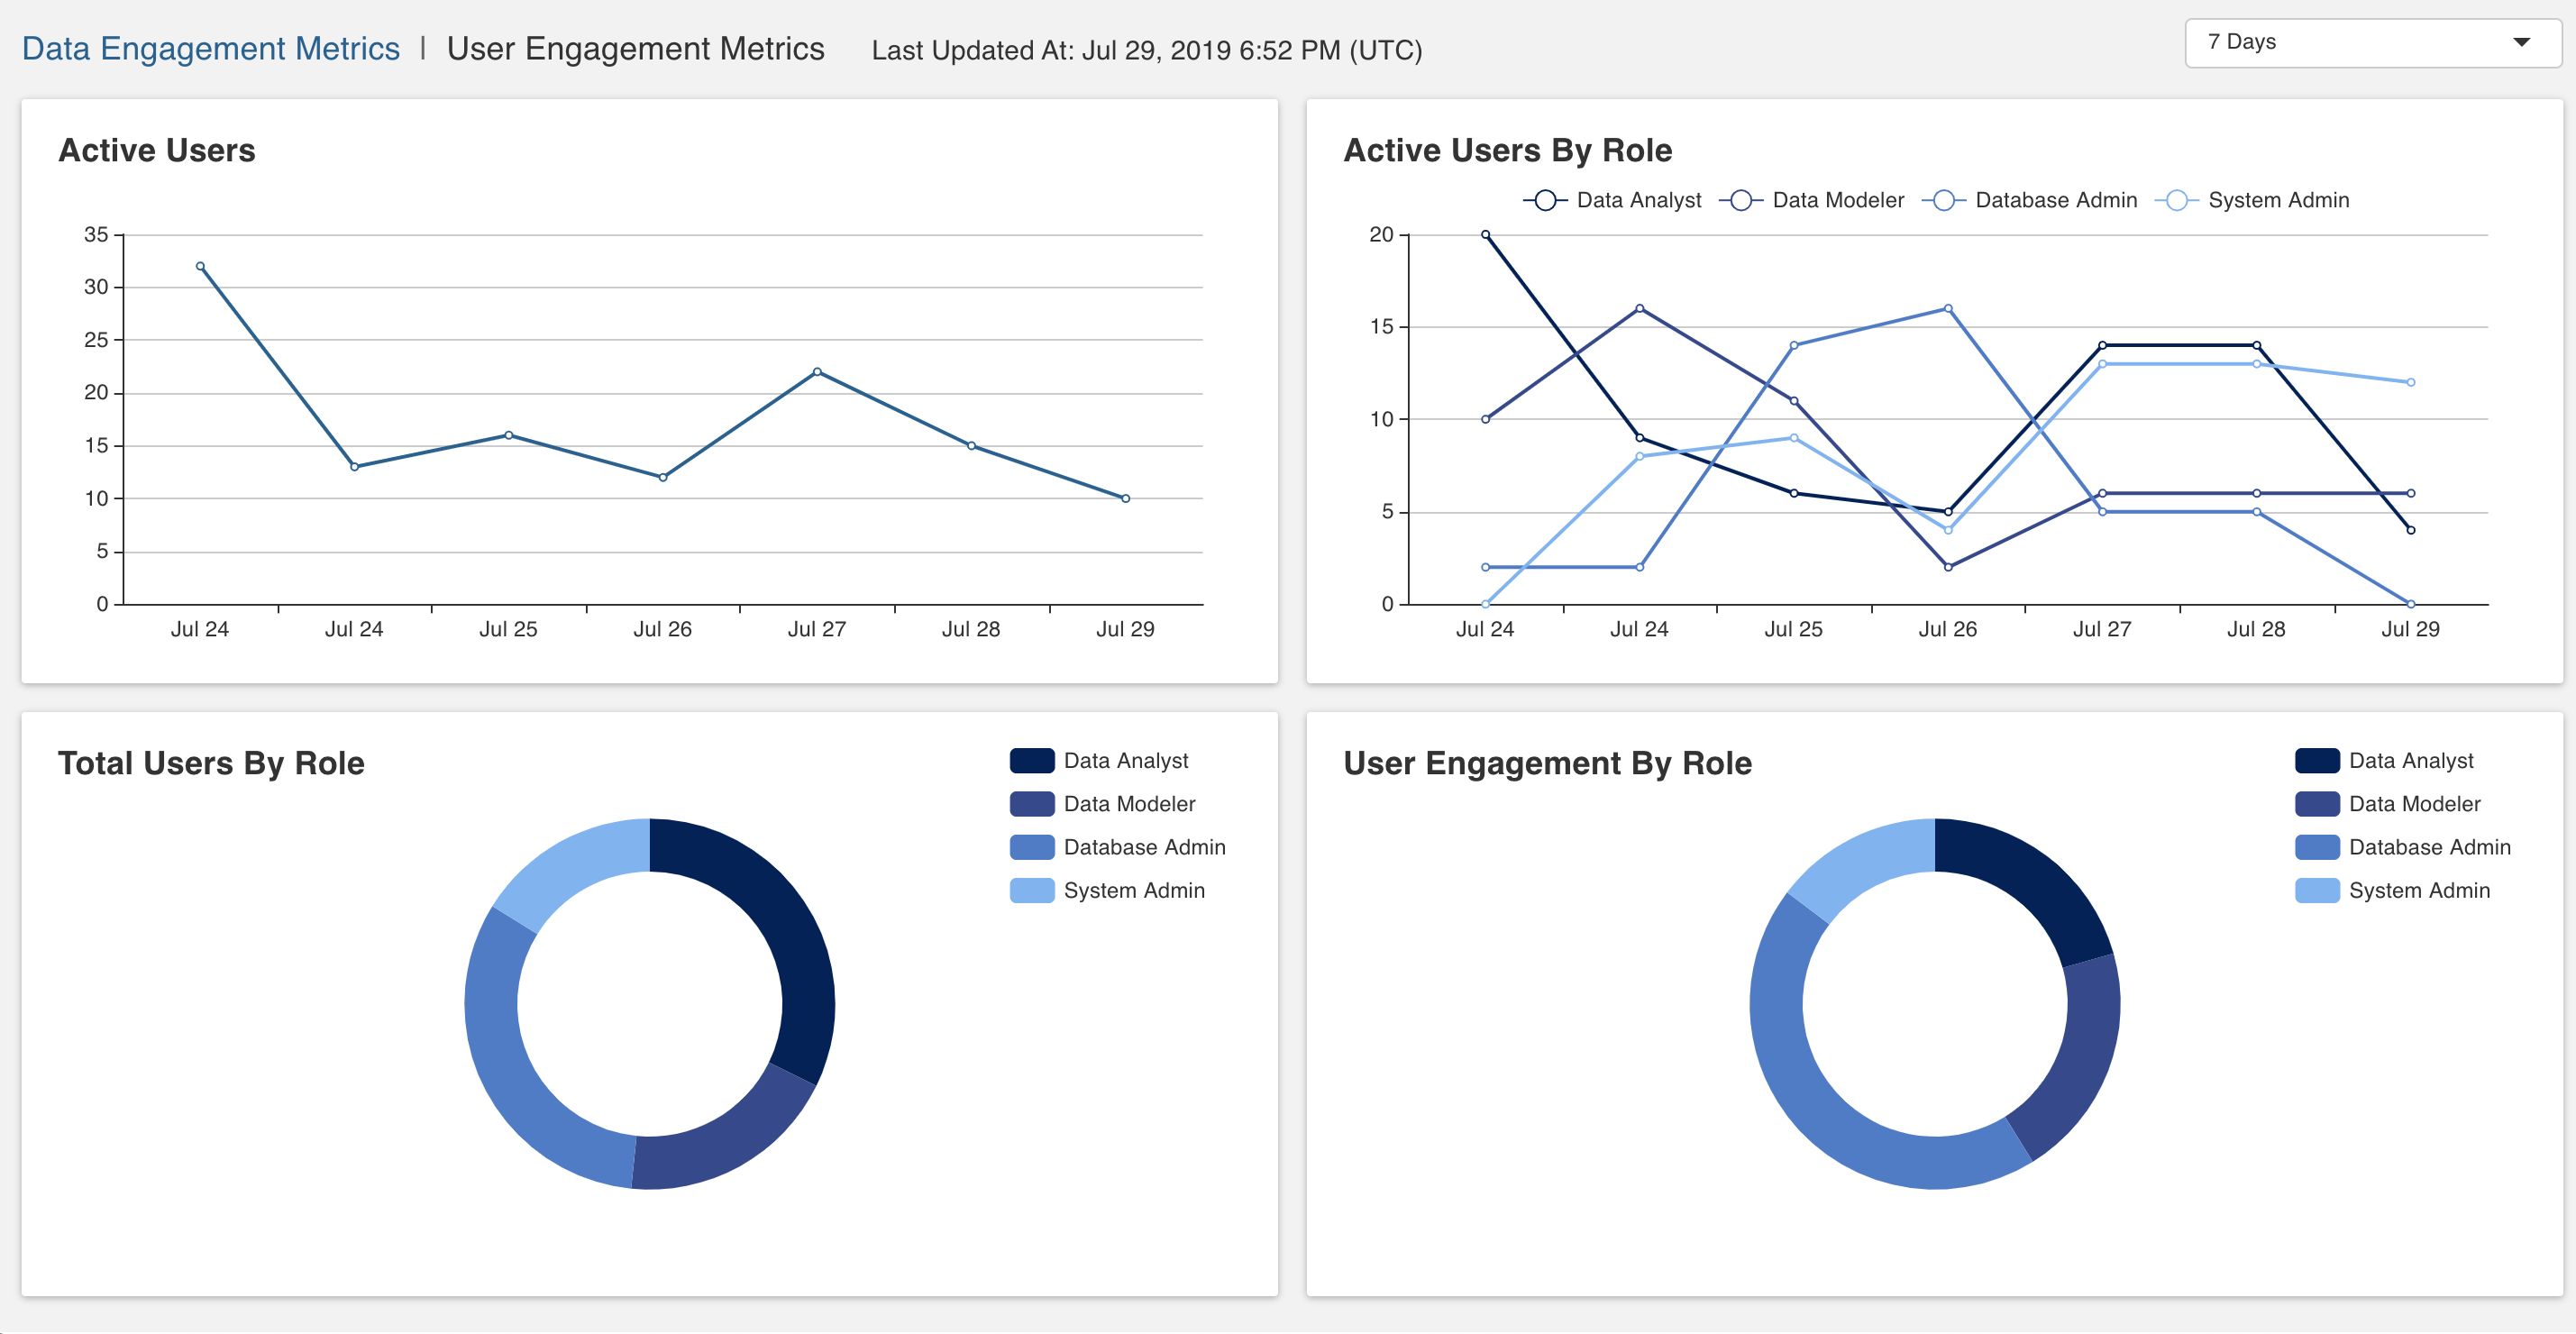
This provides details on the engagement of users on Infoworks DataFoundry such as number of active users, user roles and their associated usage statistics.
The following table describes the User Engagement Metrics items:
Item | Description |
|---|---|
Active Users | Displays users who have logged in to Infoworks DataFoundry atleast once in the selected duration. |
Active Users by Role | Displays user roles which have logged in to Infoworks DataFoundry atleast once in the selected duration. |
Total Users by Role | Displays present number of users available in the system based on user role. |
User Engagement by Role | Displays engagement of different user roles in Infoworks DataFoundry. |
$plugin[ow784axlzn]