Infoworks on Databricks home page consists of the following menu options on the menu bar:
Dashboard
The Engagement Dashboard displays the summary of key actions performed by the user on enterprise data. This provides a statistical framework to view and analyse Infoworks usage data for better business performance. It also provides details on the engagement of users from different roles, with Infoworks.
Click Dashboard menu to view the Infoworks Engagement Dashboard.
The Infoworks Engagement Dashboard consists of two tabs:
Data Filter based on Duration: The tabs are enabled with a filter button on the top right corner to enable data filter based on the duration to be considered for data population.
Data Engagement Metrics
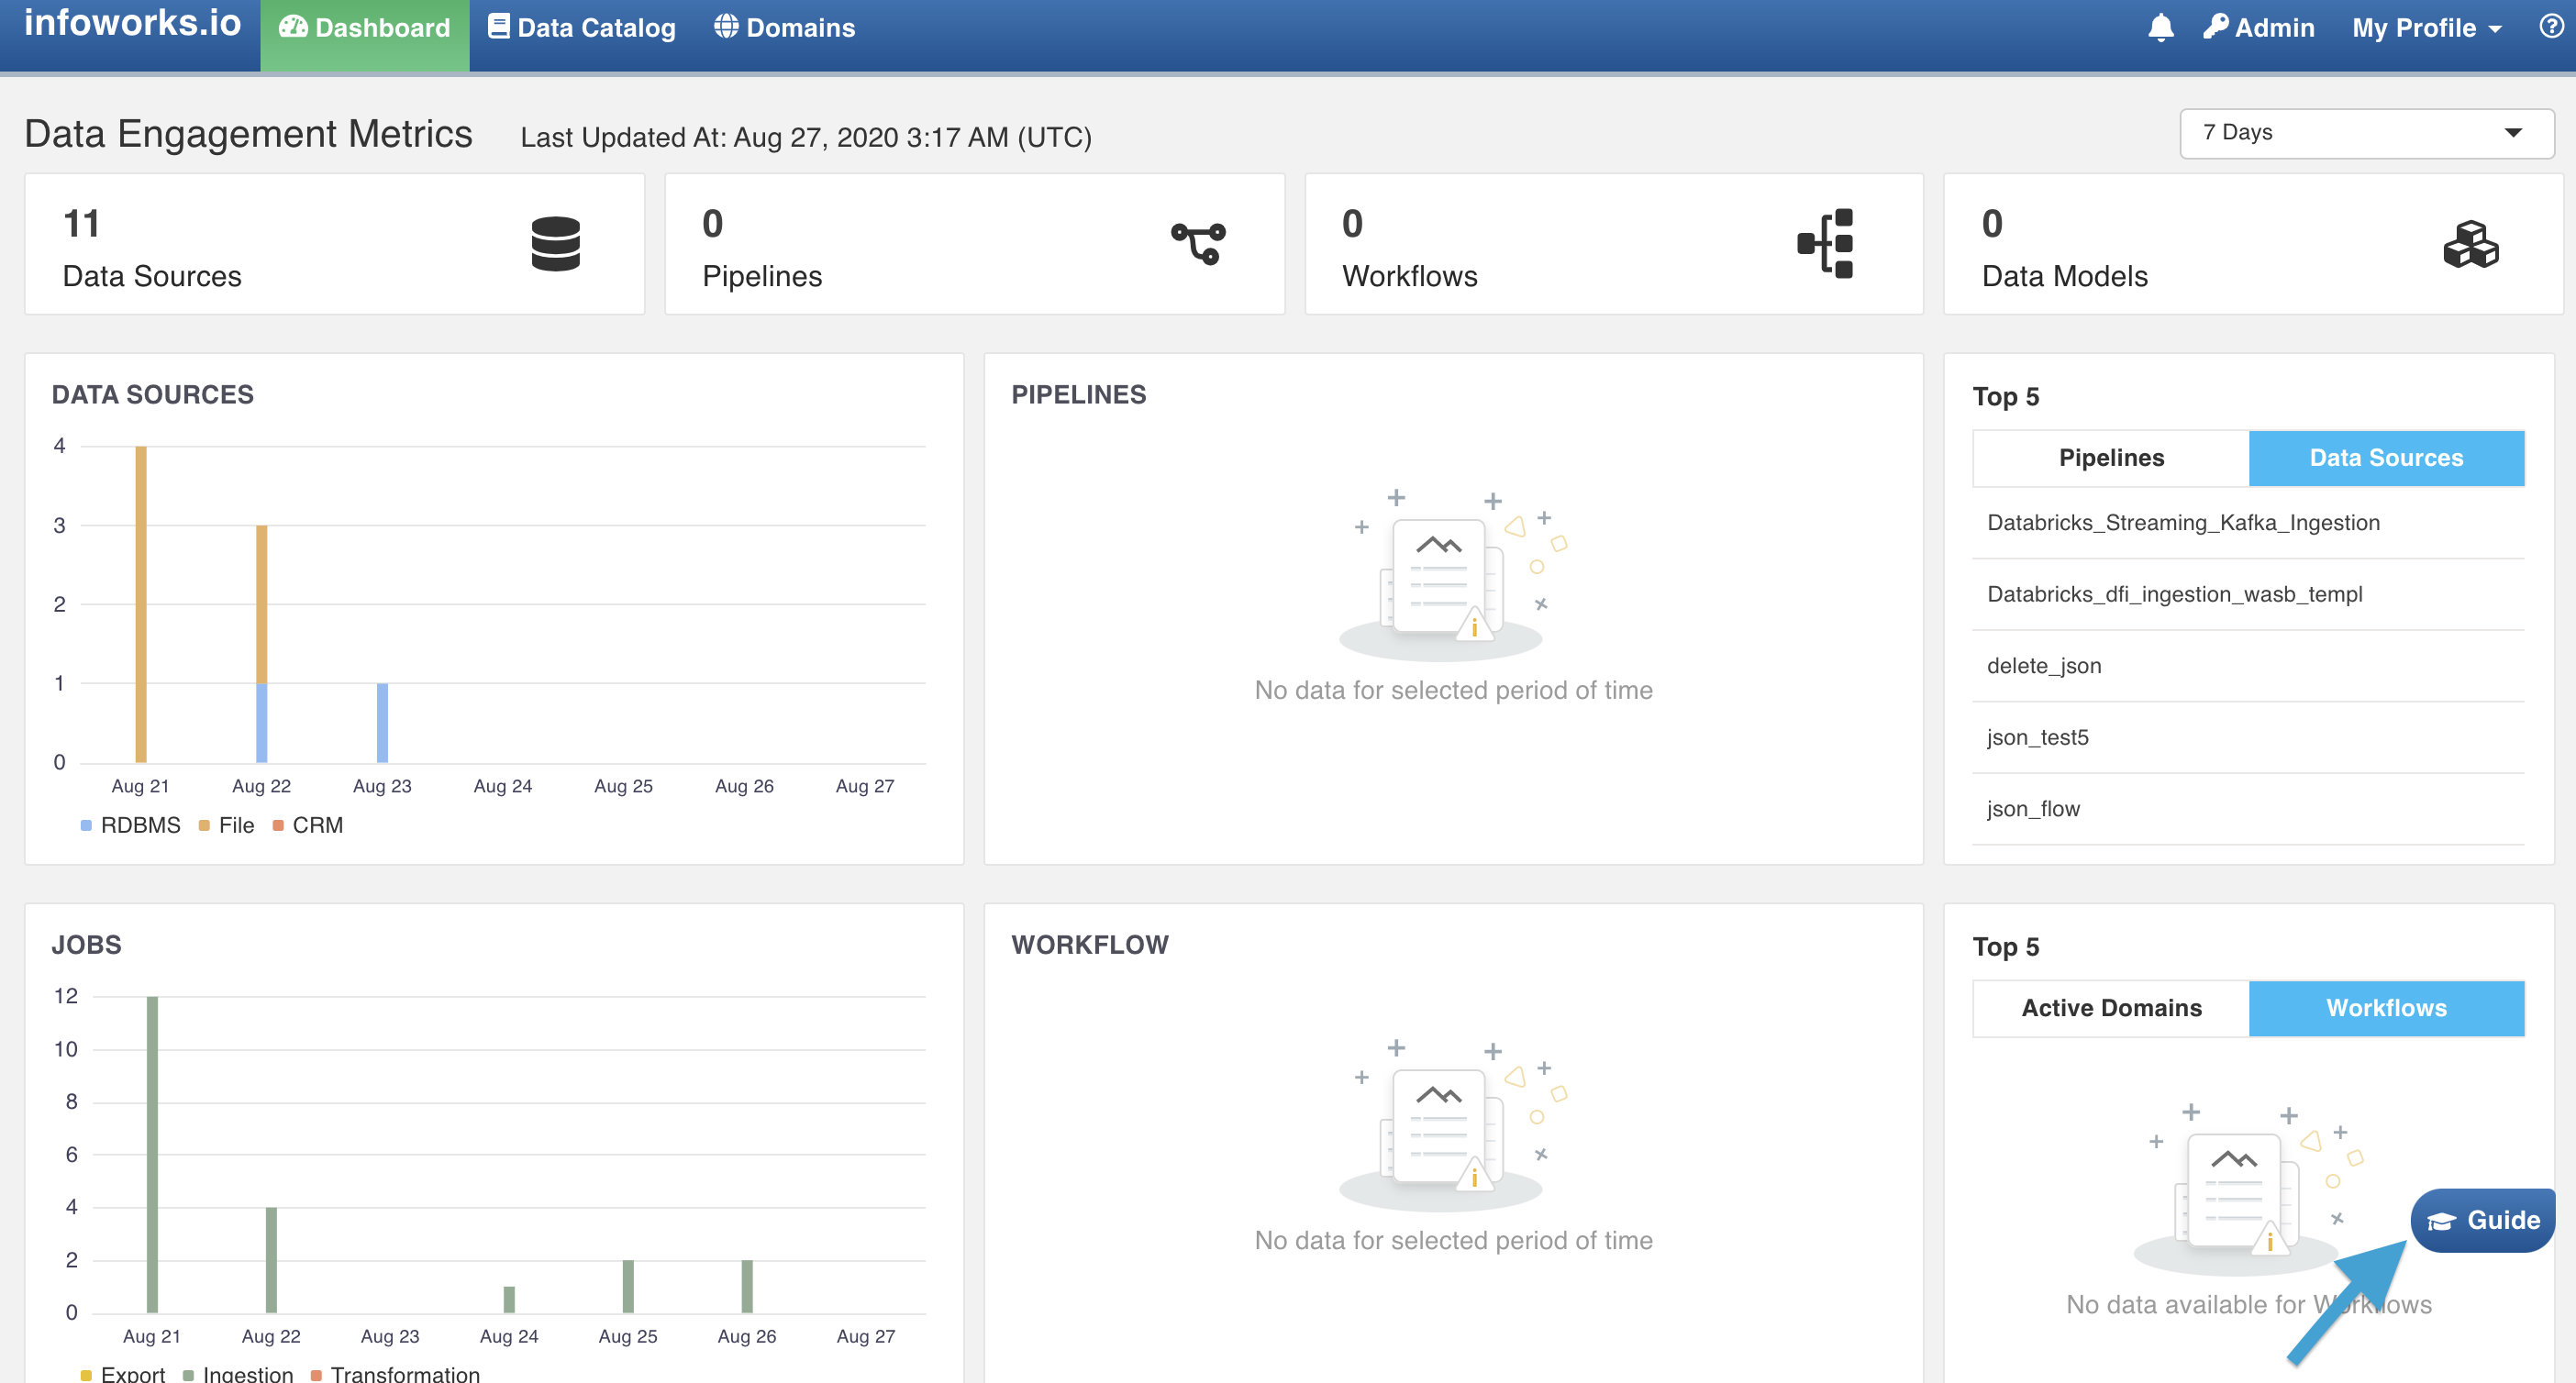
This provides a visual representation of data statistics to view and analyse data parameters such as data sources, pipelines, workflows, accelerated data models, and their associated statuses.
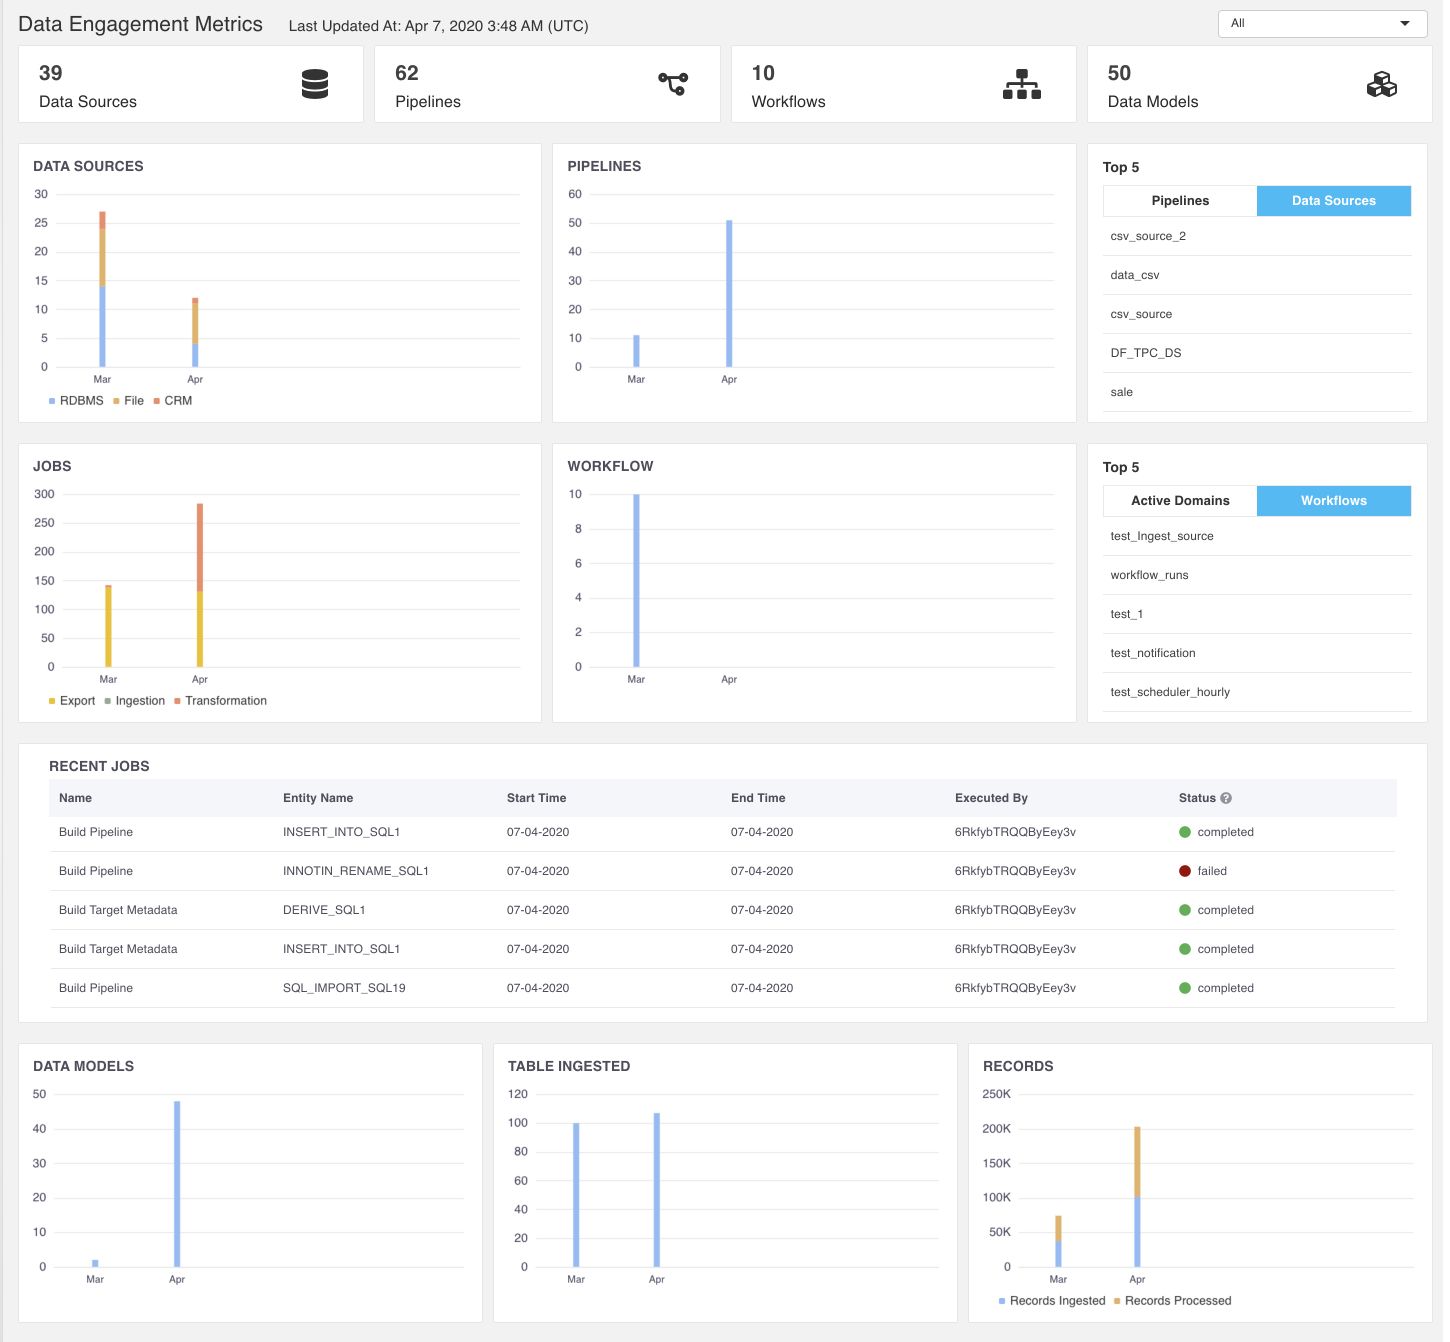
The following table describes the Data Engagement Metrics items:
Item | Description |
|---|---|
Data Sources | Displays the number of data sources created by the user. |
Pipelines | Displays the number of pipelines created by the user. |
Jobs | Displays the number of jobs run per day (machine activity) which includes data ingestion pipeline jobs, number of tables ingested, data transformation pipelines, data model builds, orchestrator workflows processed, and export jobs. |
Workflow | Displays the number of workflows created by the user. |
Top 5 | The following sections are available under the Top 5 tab:- Data Sources: Top five data sources based on the maximum number of pipelines or data exports driven.- Pipelines: Top five pipelines based on the number of times the pipelines are scheduled in a week to refresh data models.- Active Domains: Top five active domains based on the number of pipelines, models and workflows.- Workflows: Top five workflows based on the number of schedules of the workflow in a week. Active Domains: Top five active domains based on number of pipelines, models and workflows. |
Recent Jobs | Displays details of the latest twenty jobs, irrespective of their completion status, and belonging to all the users. |
Data Models | Displays the number of external pipeline targets (snowflake export). |
Tables Ingested | Displays the number of data tables ingested. |
Records | Displays the records processed and records ingested.- Records Ingested: Total number of the full load and CDC records ingested.- Records Processed: Total number of ingested records which includes full load or ongoing CDC, records processed by each pipeline, and records processed by export jobs. |
User Engagement Metrics
This provides details on the engagement of users on Infoworks such as number of active users, user roles and their associated usage statistics.
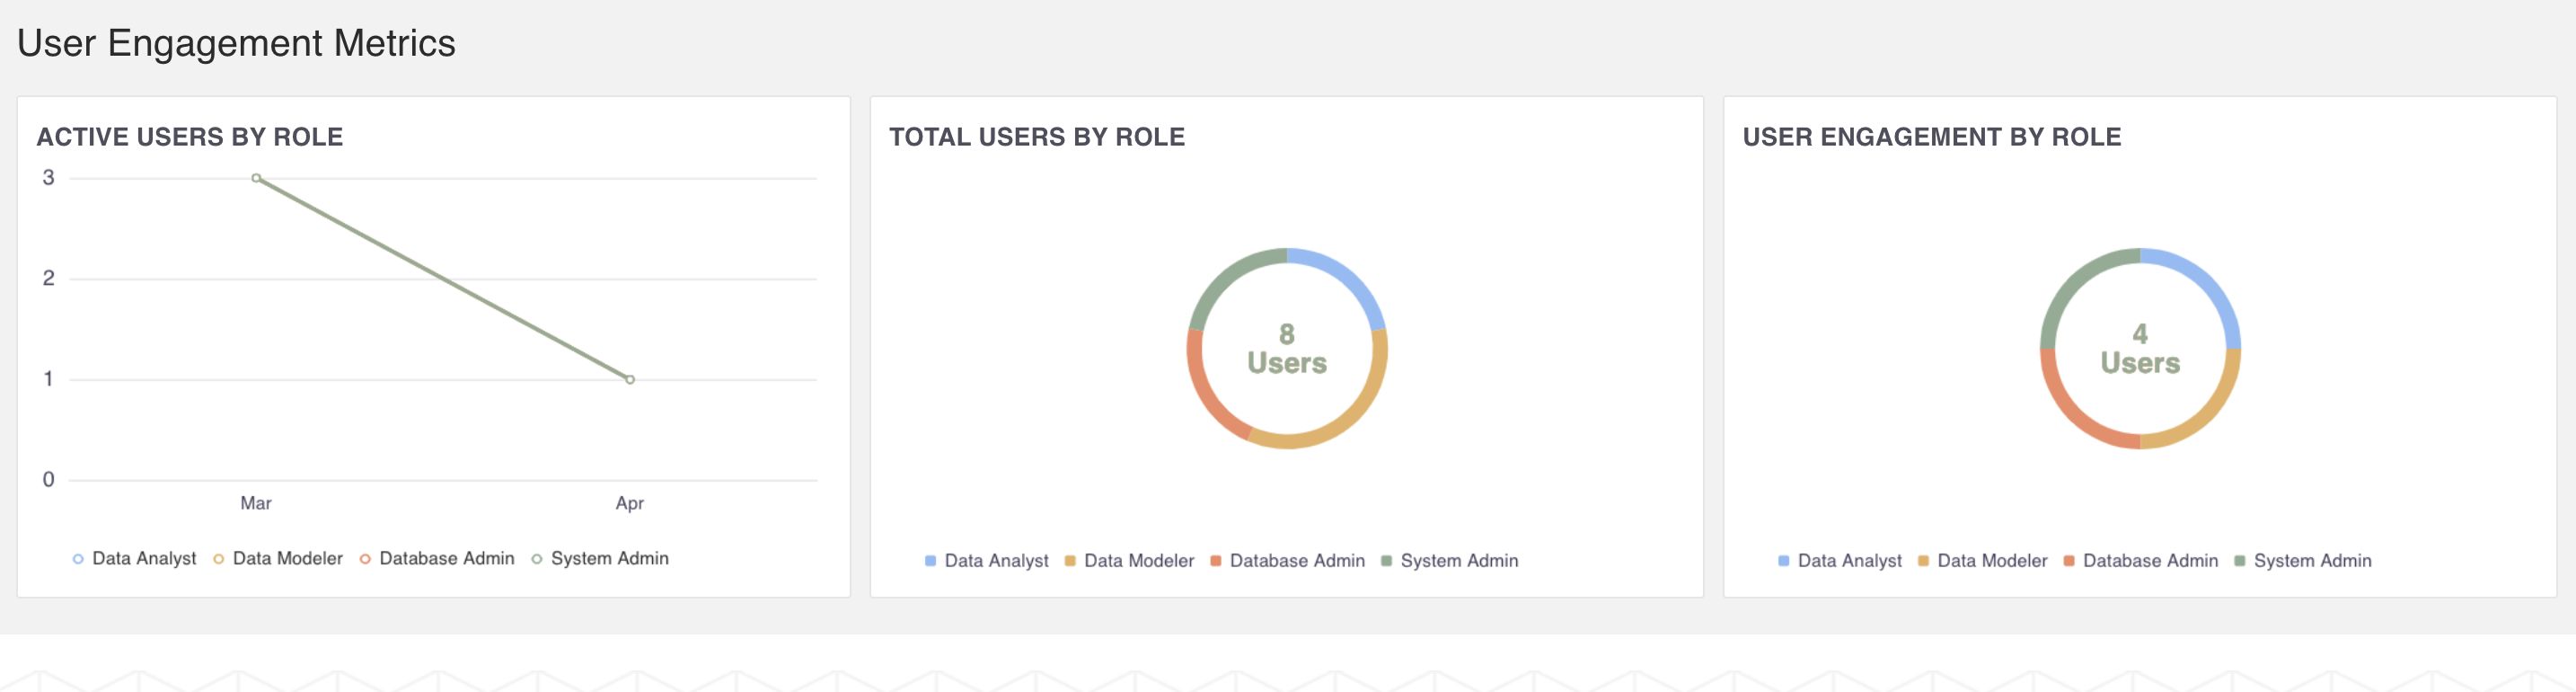
The following table describes the User Engagement Metrics items:
Item | Description |
|---|---|
Active Users by Role | Displays user roles which have logged in to Infoworks at least once in the selected duration. |
Total Users by Role | Displays the present number of users available in the system based on user role. |
User Engagement by Role | Displays engagement of different user roles in Infoworks. |
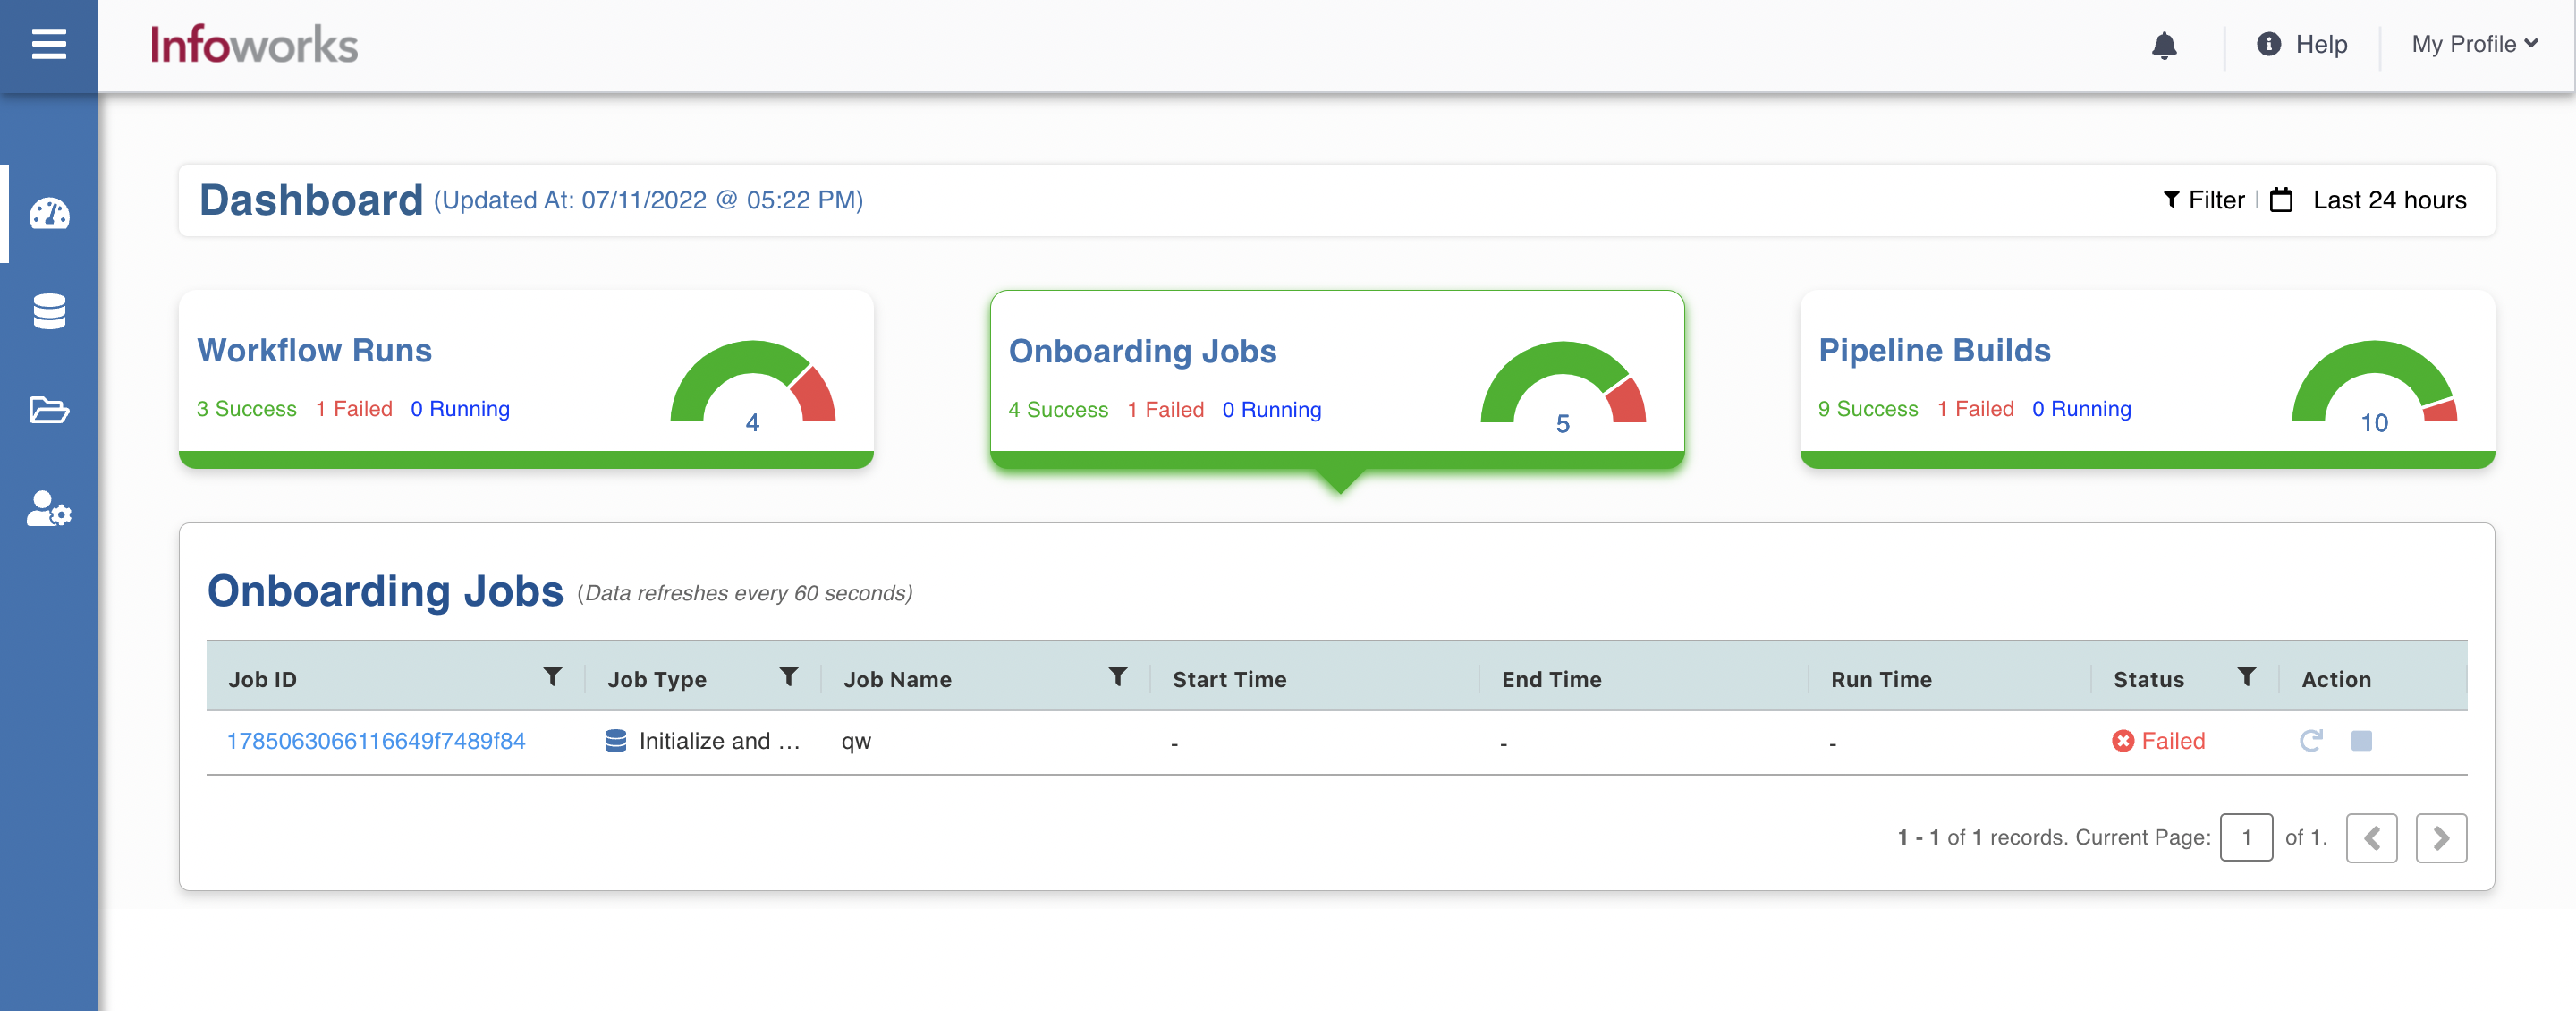
Operations Analyst Dashboard
The dashboard is designed quite differently for Operations Analyst. It provides a bird’s eye view of the Workflow Runs, Onboarding Jobs, and Pipeline Builds. By default, each widget provides the list of workflows/jobs which are currently running or have failed in the last 24 hours.
Workflow Runs
Workflow runs widget depicts the list of workflows that have failed, currently running, or completed.

NOTE When you open Operation’s Analyst dashboard, this is the default widget that appears.
The workflow related information appears in the Workflow Runs table. For more information, refer to following table.
Field | Description |
|---|---|
Workflow Run ID | Unique ID assigned to the workflow run. |
Workflow | Name of the workflow |
Domain | The domain a specific workflow belongs to. |
Start Date | The timestamp on which the workflow was initiated. |
End Date | The timestamp when workflow ended. |
Run time | Total running duration of the workflow |
Status | Status of the run. For example, Success, Running, and Failed |
Actions | You can perform the following actions, namely: Restart: For failed workflows, you can restart the workflow run. Cancel: For the currently running workflows, you can stop the workflow run. |
Onboarding Jobs
This widget shows ingest and export data job types.
When you click the Onboarding Jobs widget, the jobs related information appears in the Onboarding Jobs table. For more information, refer to the following table.
Field | Description |
|---|---|
Job ID | Unique ID assigned to the onboarding job. |
Job Type | It is set to Build Pipeline for all |
Job Name | The name this onboarding job belongs to |
Start Date | The timestamp on which the job was initiated. |
End Date | The timestamp when job ended. |
Run time | Total running duration of the job |
Status | Status of the job. For example, Success, Running, and Failed |
Actions | You can perform the following actions, namely: Restart: For failed jobs, you can restart the jobs with failed tables or all the tables. Cancel: For the currently running jobs, you can stop the job run. |
Pipeline Builds
Pipeline jobs widget will show build pipeline jobs.
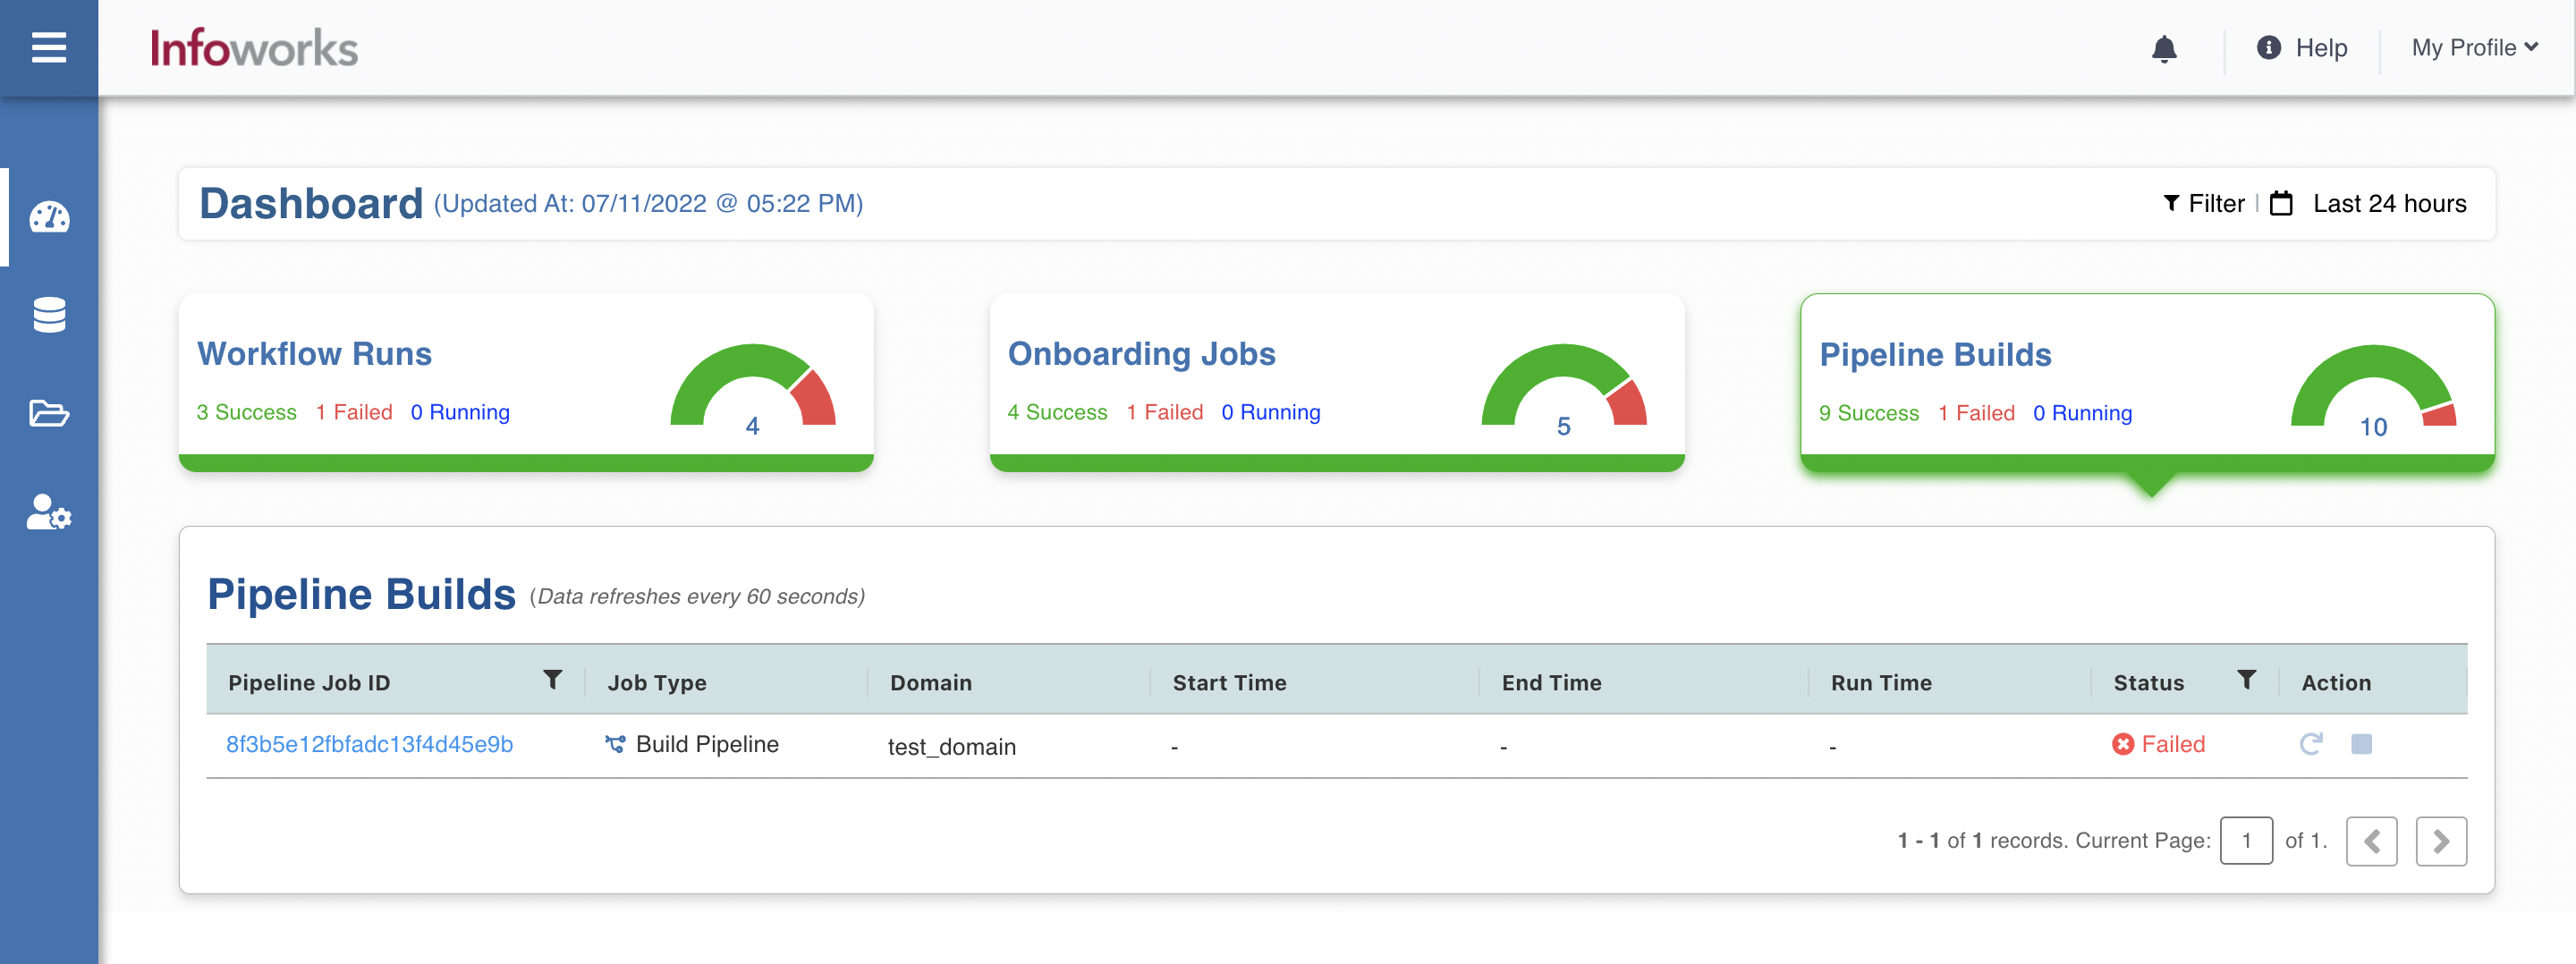
Field | Description |
|---|---|
Pipeline Job ID | Unique ID assigned to the pipeline job. |
Job Type | It is set to Build Pipeline for all |
Domain | The domain this pipeline job belongs to |
Start Date | The timestamp on which the job was initiated. |
End Date | The timestamp when job ended |
Run time | Total running duration of the job |
Status | Status of the job. For example, Success, Running, and Failed |
Actions | You can perform the following actions: Resubmit: For failed jobs, you can resubmit the job run Cancel: For the currently running jobs, you can stop the job run. |
Advanced Filters
There are advanced filters available to filter the jobs based on domains and sources. It helps them to quickly identify problem areas, such as failed workflows and jobs, large number of anomalies, jobs that are taking longer than usual, etc. To see how the dashboard looks for an Operations Analyst, refer to the below given image.
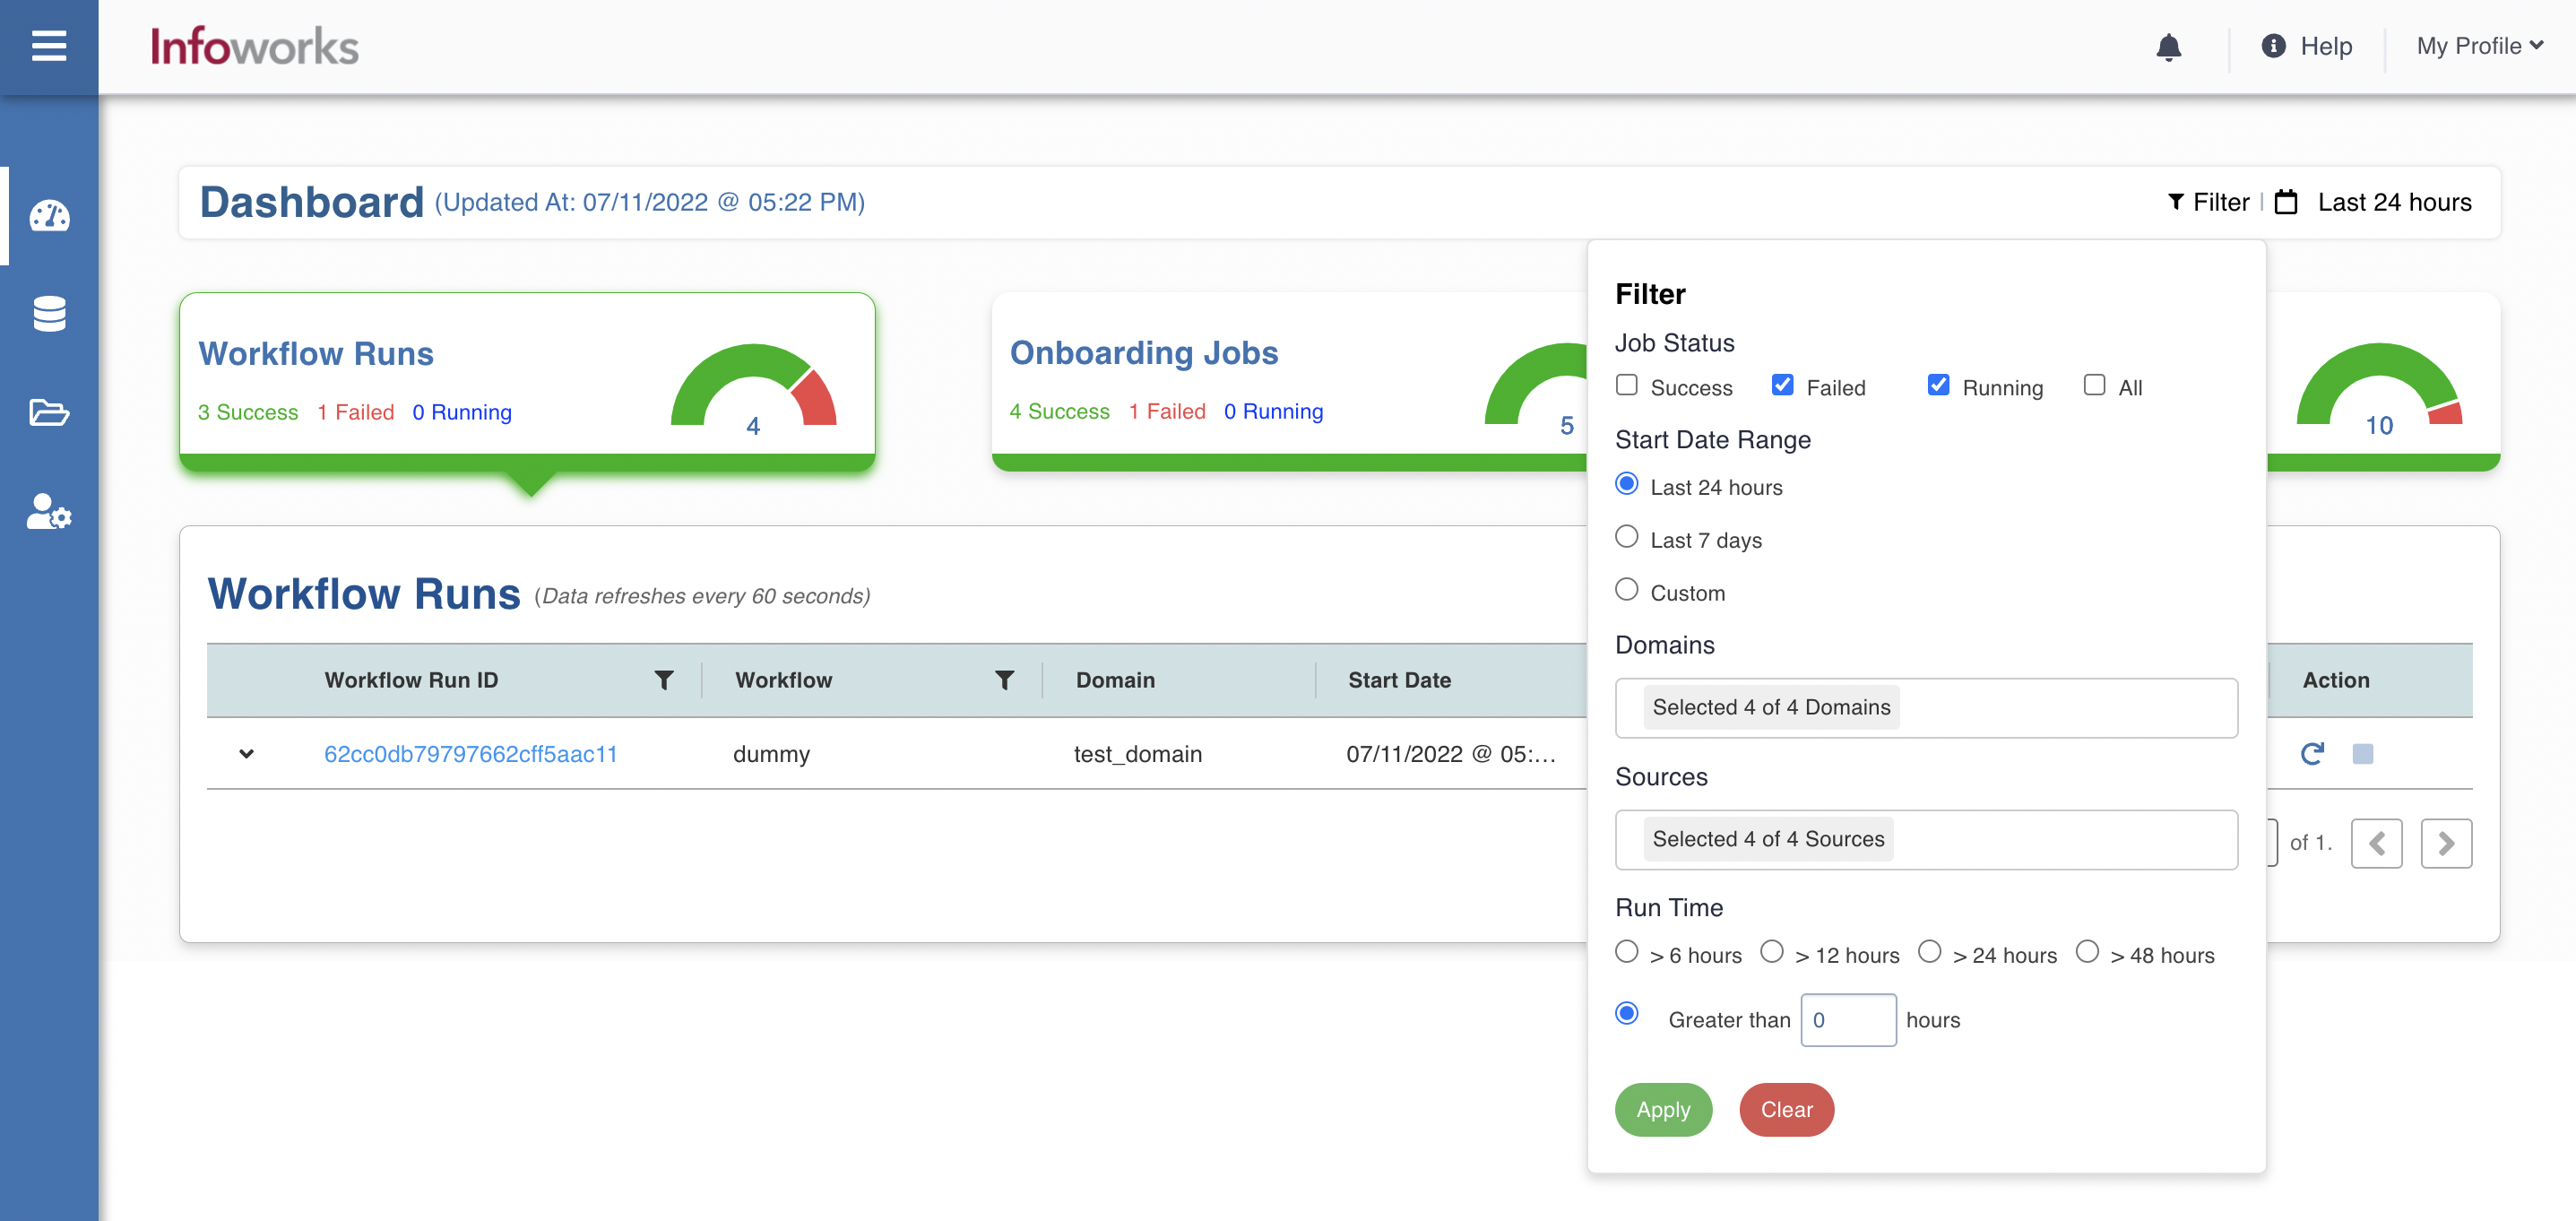
For more information, refer to the following filter fields.
Field | Description |
|---|---|
Job Status | Filters the workflows/jobs based on the status, such as Success, Failed, Running, and All. |
Start Date Range | Filters based on timestamp range, such as Last 24 hours, Last 7 days, and Custom. |
Domains | Filters workflows and pipelines based on domain name. |
Sources | Filters onboarding jobs based on source name. |
Run Time | Filters based on the duration of the job/workflow. |
Data Catalog
Data Catalog enables you to search data in a single section regardless of access controls.
It display the following catalogs:
all data sources that have been crawled, ingested and synchronized.
all data pipeline targets that have been created using transformation pipelines.
Domains
Domains allow separate workspaces for different users to collaborate on data transformations and workload orchestration. Domains menu displays the list of all available domains in your Infoworks instance. For more details, see Managing Domains.
Admin
Admin menu lists the following admin options:
Service Management
Job Search
Job Queue
Notifications
Reset Locked Entities
For more details, see Admin and Operations
Login Settings
The logged-in username is displayed as the Login Settings menu. This allows the user to navigate to user settings, or to log out of your Infoworks instance.
Help Documentation
The help icon allows the user to view the help content for respective screens.
Guide
The Guide button at the bottom of every page allows you to experience an interactive tutorial which explains how intelligent automation enables rapid and easy implementation and deployment of complex analytics and AI/ML use cases.